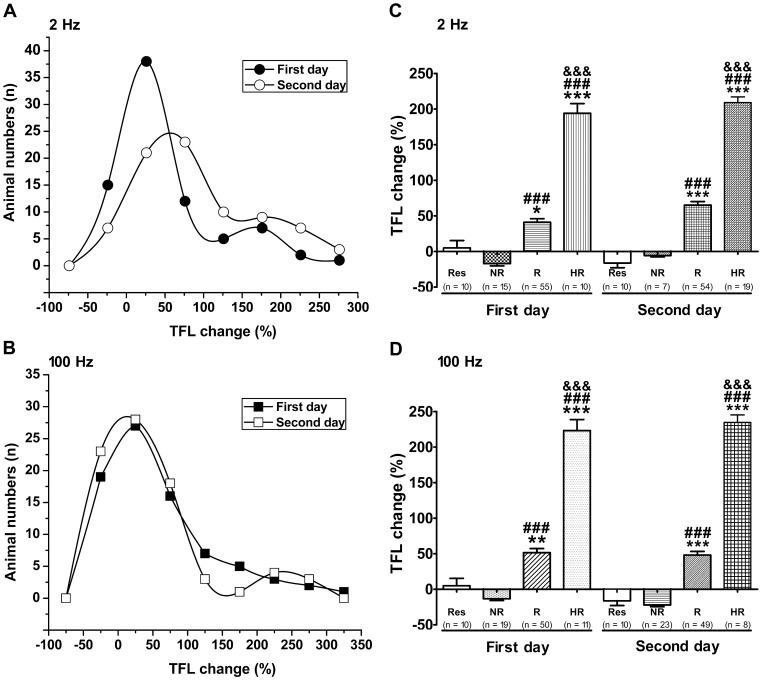
Figure 1. Analgesic effect induced by 2 Hz and 100 Hz EA in rats.
The analgesic effects of EA on acute thermal pain were quantified using the TFL test, and they are expressed as percent changes from basal TFL. Either 2 Hz (A) or 100 Hz (B) EA, rats showed individual differences in sensitivity of EA analgesia for two consecutive days. A majority of rats showed sensitivity to EA analgesia (TFL change >0) and a small part appeared in contrary way (TFL change ≤0). Plan C and D showed comparison of the EA analgesic effects among the high-responder (HR), responder (R), and non-responder (NR) or restraint (Res) group in two consecutive days. Data are represented as mean ± SEM. One way ANOVA and Bonferroni’s Multiple Comparison Test was used to analysis TFL change (%). *P<0.05, **P<0.01, ***P<0.001 vs. restraint group; ### P<0.001, vs. compared with the corresponding NR group; &&& P<0.001, compared with the corresponding R groups.

