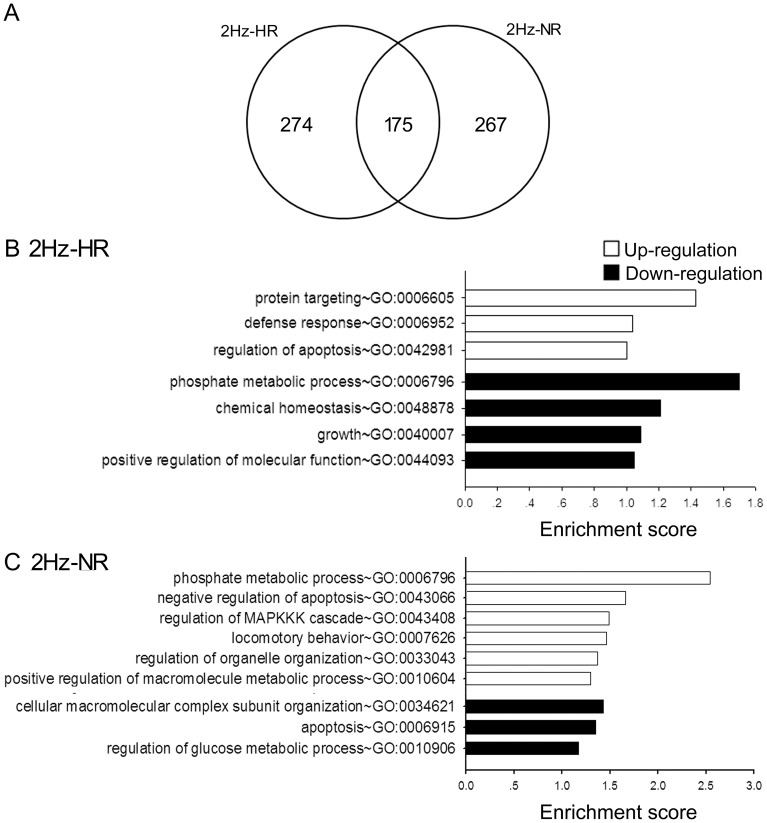
Figure 3. Overlapped and non-overlapped gene expression and enriched GO categories in 2 Hz-HR and NR rats.
A: Venn diagram comparing the number of genes/ESTs identified as differentially expressed in HR and NR after 2 Hz EA stimulation at 1 hr time point. B and C: Enriched GO categories of specially regulated genes in 2 Hz-HR and 2 Hz-NR. The complete gene list of each GO category is accessible at: Table S3A.

