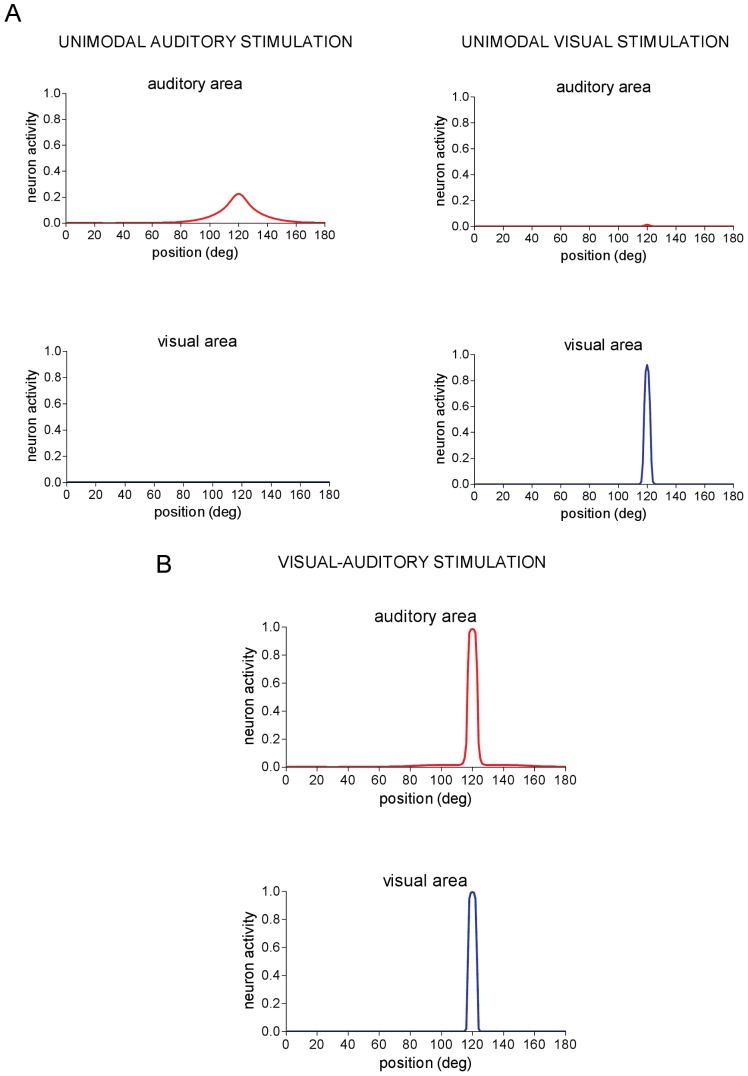
Figure 2. Network response to unimodal stimulation and to cross-modal spatially coincident audio-visual stimulation.
(A) A unimodal stimulation was applied to the network and maintained constant throughout the entire simulation. Neural activity is shown in the new steady-state reached by the network. Left panels - Neuron activity in the auditory and visual areas in response to an auditory stimulus of amplitude  = 15 applied at position pa = 120°. No activity is elicited in the visual area. Right panels - Neuron activity in the auditory and visual areas in response to a visual stimulus of amplitude
  = 15 applied at position pv = 120°. No significant activity is elicited in the auditory area. (B) An auditory stimulus and a visual stimulus are simultaneously applied at the same spatial position (pa = pv = 120°) and maintained constant throughout the simulation. Network response is shown in steady-state condition. Auditory and visual stimuli have the same strength (
 =
=  = 15). Strong reinforcement and narrowing of auditory activation occurs (compare with Fig. 2A, left panels).

