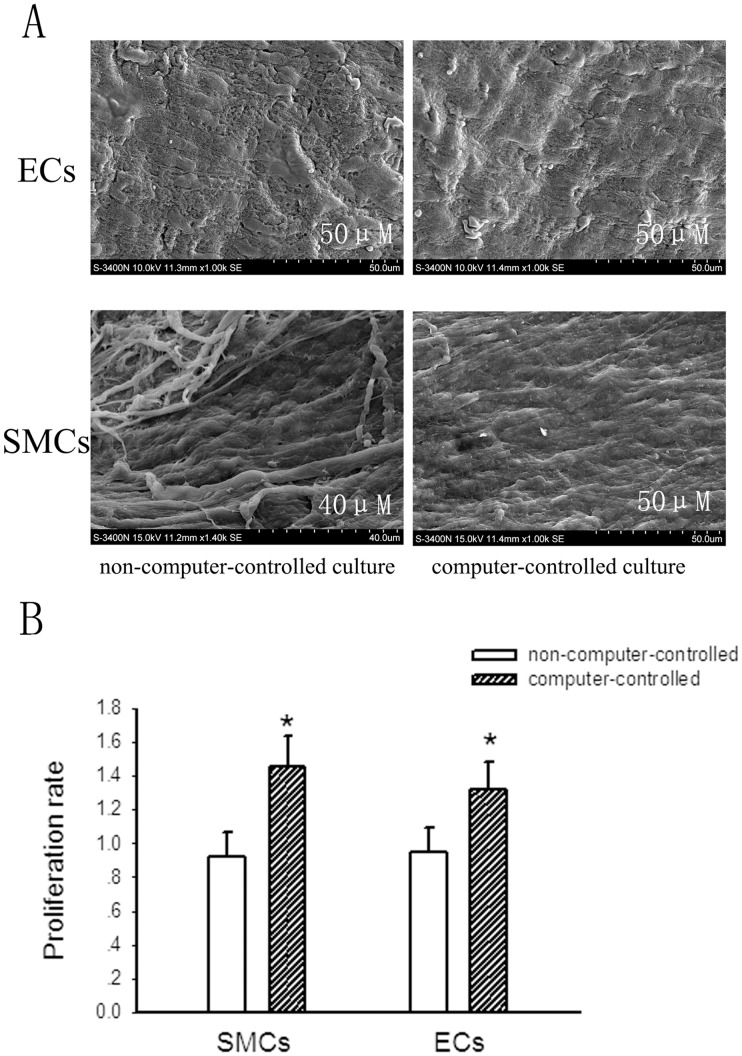
Figure 10. The comparison of cell survival and morphous of constructs between cultured in the computer-controlled bioreactor and the non-computer-controlled bioreactor.
A, SEM analysis of endothelial cells and smooth muscle cells cultured both in the computer-controlled and non-computer-controlled system after 2 weeks, respectively. B, the proliferation of endothelial cells and smooth muscle cells cultured both in the computer-controlled and non-computer-controlled system after 2 weeks determined by MTT assay. Bars are mean ± S.D. from three independent experiments. *P<0.05.

