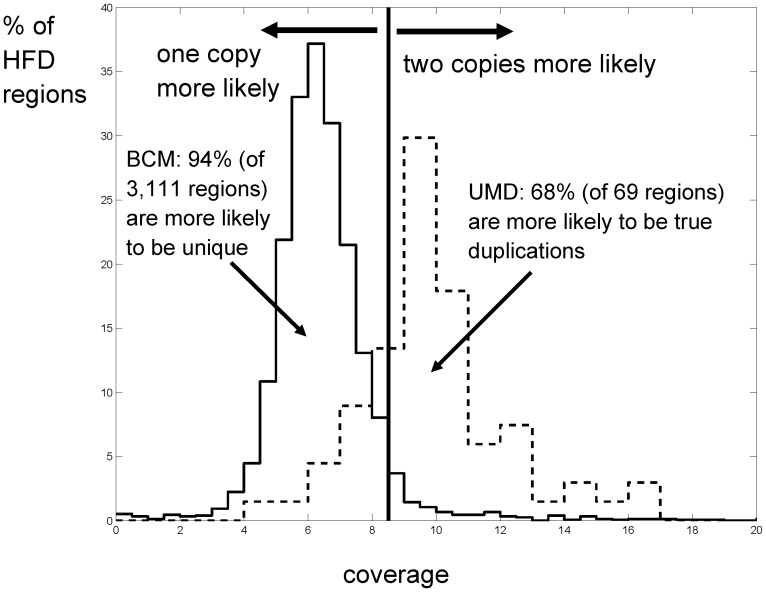
Figure 1. Histogram of the percentage of HFDs that belong to (i) set B2U1, duplicated in Btau 4.2 and single copy in UMD Bos taurus 3.1 (solid line), and (ii) set B1U2, single copy in Btau 4.2 and duplicated in UMD Bos taurus 3.1 (dashed line).
The area under each curve integrates to 100%. The histograms were computed by mapping the WGS reads to both assemblies. The average WGS read coverage of the assemblies is 5.9. The solid vertical line is placed at 5.9/ln(2), the coverage at which it is equally likely that a region occurs in two copies versus one. 47 of the 69 regions (68%) in B1U2 are on the right hand side of the line and thus they are more likely to be true segmental duplications. 94% of the 3,111 HFDs in Btau 4.2 (set B2U1) are more likely to be unique in the genome and thus probably represent assembly errors in Btau 4.2.

