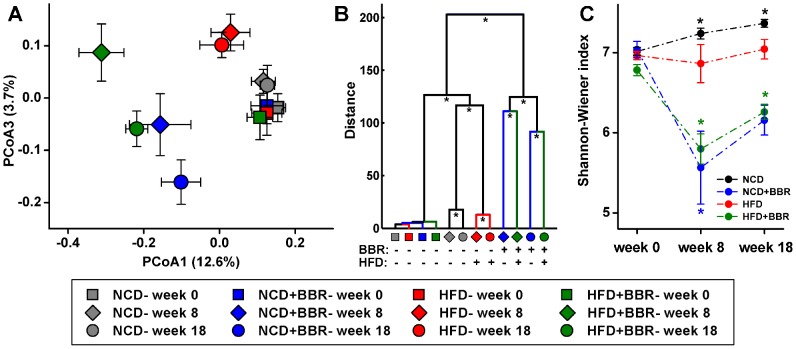
Figure 4. Overall structural changes of gut microbiota.
(A) PCoA score plot based on unweighted UniFrac metrics. Each point represents the mean principal component scores of all rats in a group at one time point, and the error bar represents the standard deviation. (B) Clustering of gut microbiota based on mahalanobis distances calculated using MANOVA, * P<0.05. (C) Shannon-Wiener index, calculated after rarefying to an equal number of sequence reads for all samples. Values are expressed as means ± standard error. * P<0.05, significant difference when compared with the 0th week value as assessed by ANOVA.

