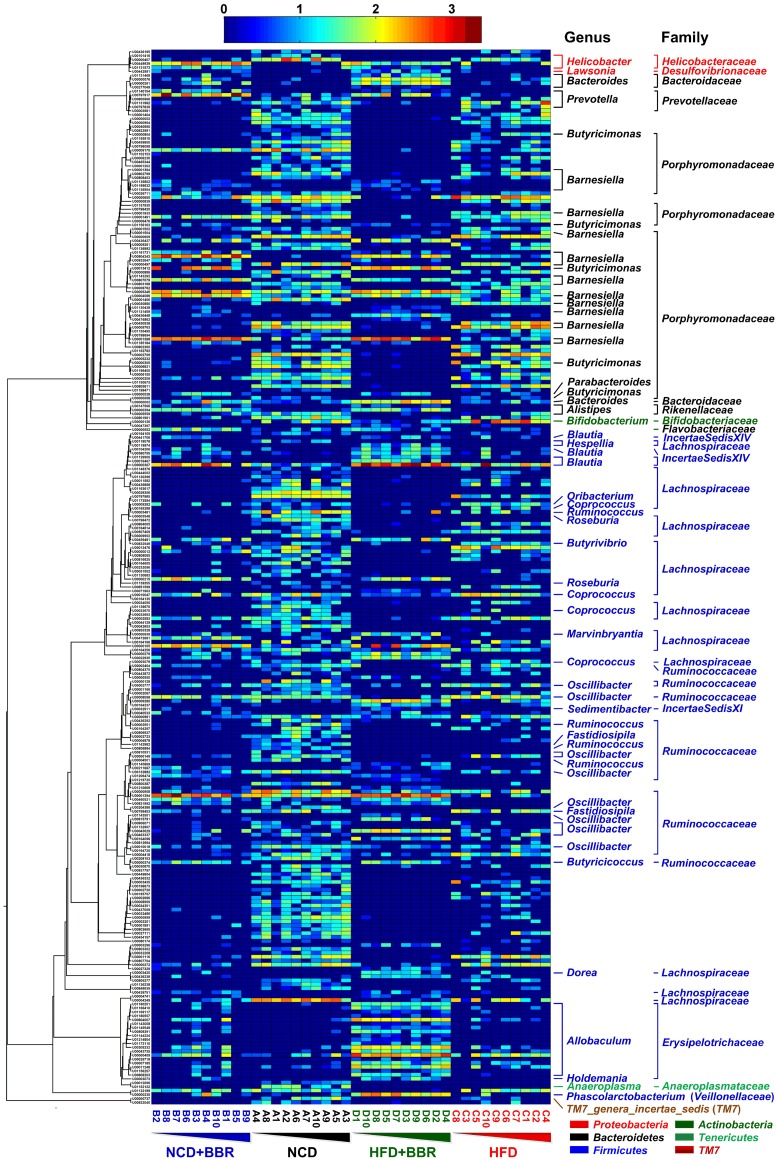
Figure 6. Heat map of RDA-identified key OTUs responding to berberine treatment.
The color of the spot corresponds to the normalized and log-transformed relative abundance of the OTU. The OTUs are organized according to their phylogenetic positions. The family and genus names of the OTUs are shown on the right. Samples in each group were organized according to the adiposity index (ascending order).

