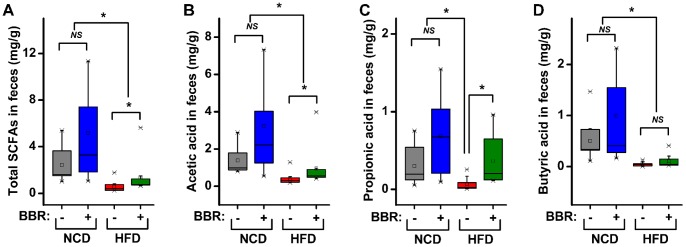
Figure 7. Fecal concentrations of SCFAs in rats.
Levels of total SCFAs (A), acetic acid (B), propionic acid (C), and butyric acid (D) are shown. Total SCFA levels were calculated as the sum of acetic acid, propionic acid, butyric acid, n-valeric acid, isobutyric acid, and isovaleric acid. The median (central thick lines), 25% and 75% quartile ranges (box width), and upper and lower limits (error bar) of each group are shown in the box plot. Differences were assessed by the Mann-Whitney test, * P<0.05; NS not significant.

