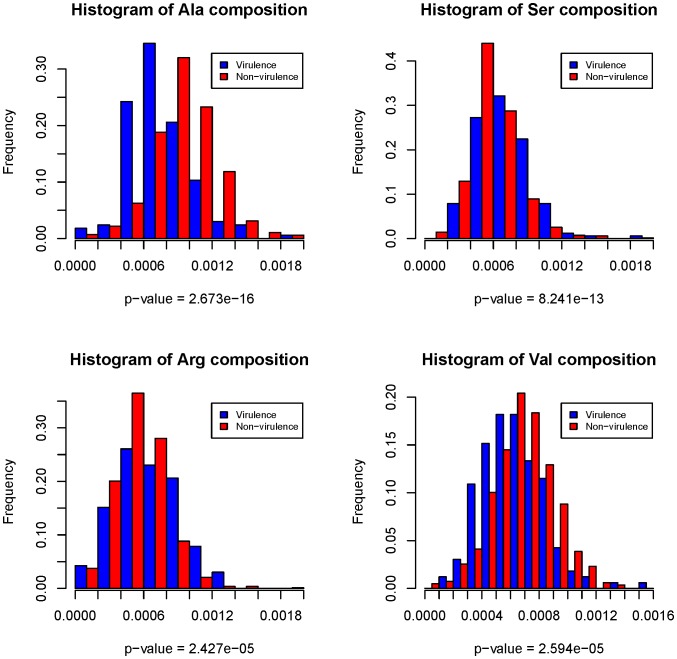
Figure 3. Histogram illustration to show the difference of the amino acid occurrence frequency between virulence and non-virulence factors.
The histograms were plotted for Ala, Ser, Arg, and Val in UPEC 536, respectively. X-axis is the amino acid composition, while y-axis is the frequency of sequences that own the corresponding amino acid composition in the dataset. P-values are given by the Wilcoxon rank sum test and measure how much evidence we have against the null hypothesis that the amino acid composition distribution is the same for virulence and non-virulence factors. Traditionally, when p-value <0.05, we say the null hypothesis is rejected, that is, the amino acid composition distribution is significantly different for virulence and non-virulence factors. The feature distribution histograms and p-values show the difference of the amino acid composition frequencies between virulence and non-virulence factors is significant, and thus it is reasonable to pick out virulence factors from proteomes based on amino acid composition features.

