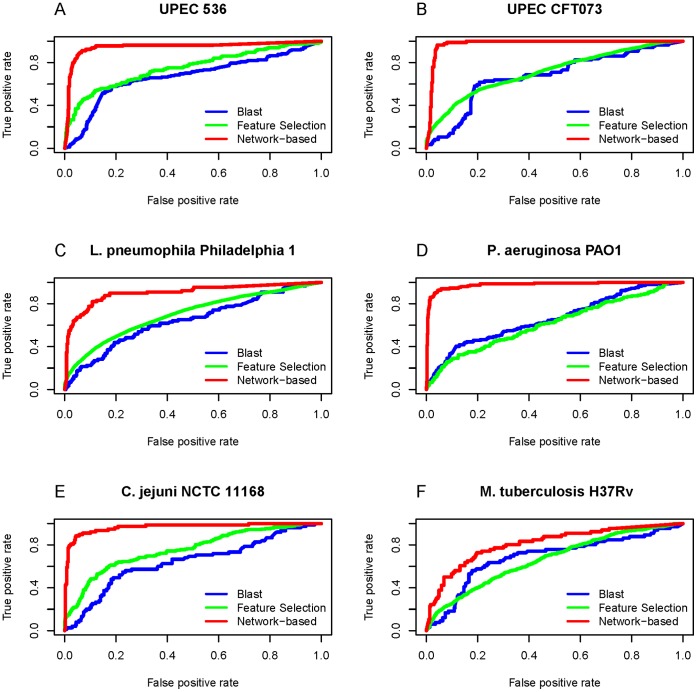
Figure 4. The ROC curves of true positive vs. false positive for the three different prediction methods.
The curves for the network-based method are colored in red, while those for the BLAST method and the feature selected method in blue and green respectively. It can be seen that of the three methods, the network-based method had the best performance for all the following six cases: (A) UPEC 536; (B) UPEC CFT073; (C) L. pneumophila Philadelphia 1; (D) P. aeruginosa PAO1; (E) C. jejuni NCTC 11168; (F) M. tuberculosis H37Rv.

