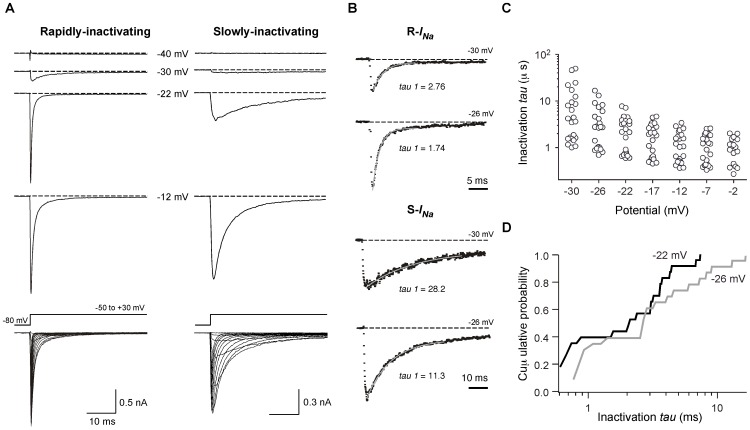
Figure 4. Distinct subpopulations of DRG neurons based on Na+ current (INa) inactivation kinetics.
A, Representative traces ensemble for Rapidly/Slowly-inactivating INa acquired using whole-cell patch-clamp. Holding potential: −80 mV; test potentials are indicated for each trace. Superimposed Rapidly/Slowly-inactivating INa were evoked by a series of voltages steps to potentials ranging between −70 and +40 mV from a holding potential of −80 mV (bottom). For illustrative purposes, current traces from −50 to +30 mV are shown. B, Curve fitting examples and time constants (tau) for the decay phases from Rapidly/Slowly-inactivating INa traces. Single exponential functions are represented by gray lines. Holding potential: −80 mV; test potentials are indicated for each trace. C, Dot plots represent current decay/inactivation time constant fitted to a single exponential process at the indicated potential. D, Cumulative probability distribution of inactivation ταυ values obtained at the indicated conditioning potentials.

