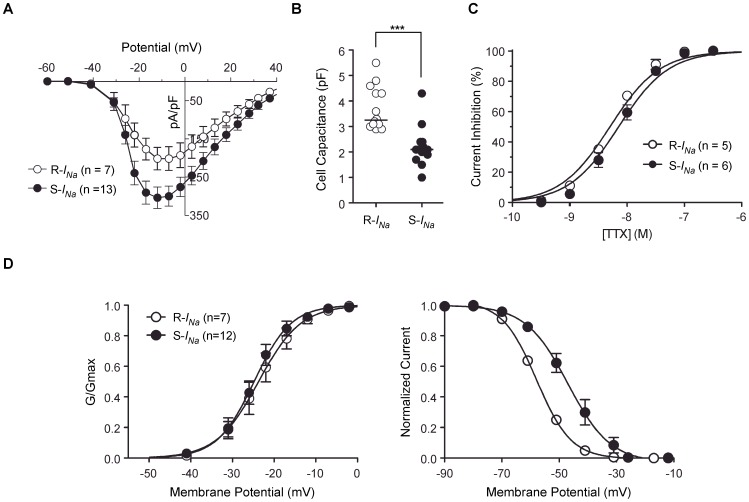
Figure 5. Characterization of R-and S-INa recorded in zebrafish DRG neurons.
A, The current density versus test potential (I–V) relationship for R- and S-INa. B, Dot plots represent the membrane capacitance of DRG neurons displaying R- (open circles) and S-INa (filled circles). Vertical bars represent the median. *** P<0.001, Mann-Whitney U-test. C, Concentration-response curves for block of the R- and S-INa by tetrodotoxin (TTX). Solid lines represent nonlinear regression least-square fits of experimental points to a Hill equation (see under Material and Methods). D, The voltage-dependence of the Na+ conductance (GNa, left panel) and steady-state inactivation (right panel) of R- and S-INa. Conductance was calculated from GNa = INa/(Vm−Vrev), in which INa is the peak current, Vm is the potential of the test pulse, and Vrev is the reversal potential for INa. The solid line represents a nonlinear regression fit to the Boltzmann function: 1/(1+exp[−(V−V1/2)/k]), where V is the step membrane potential, V1/2 is the half-activation potential, and k is a slope factor. Voltage-dependence of inactivation was determined using a 200 ms conditioning pulse followed by a test pulse to −10 mV. Test pulse currents were normalized to the maximal value. Solid line is a fit to the Boltzmann equation (k is negative for inactivation curve). Error bars on each symbol represent the mean ± s.e.m. The number of neurons tested is shown in parentheses.

