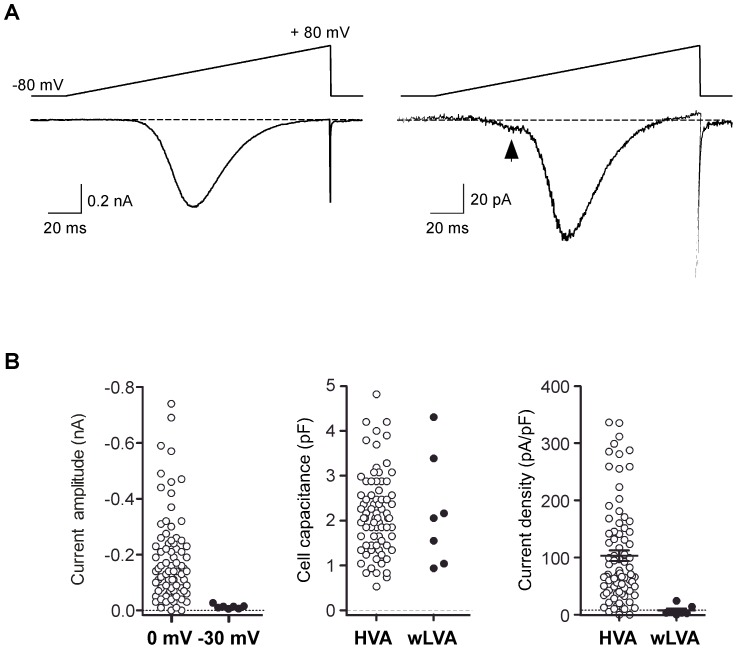
Figure 7. Ca2+ currents (ICa) from single dissociated DRG neurons.
A, Two representative traces of ICa acquired from separated neurons using whole-cell patch-clamp. ICa were evoked by a 160 ms ramp from −80 to +80 mV (top of traces) from a holding potential of −80 mV. A tiny “hump” (arrow) in the ramp current, indicative of low-voltage-activated ICa was observed in some neurons (right). B, Dot plots representing current amplitude (left panel), membrane capacitances (middle panel) and current density (pA/pF, right panel) of DRG neurons with (closed circles) and without (filled circles) low-voltage-activated components. Statistical significance was determined using an unpaired t-test with Welch's correction for unequal variance (P>0.05, middle panel). Error bars represent s.e.m.

