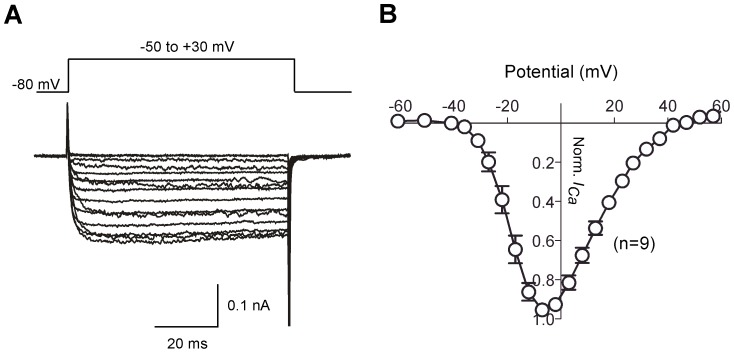
Figure 8. Ca2+ current-voltage (I–V) relationships from zebrafish DRG neurons.
A–B, Superimposed ICa traces (A) and means normalized (to maximal amplitude) I–V relationships (B). Current traces were evoked by a series of voltages steps to potentials ranging between −80 to +60 mV from a holding potential of −80 mV. For illustrative purposes, only traces from −50 mV to −30 mV are shown. Error bars on each symbol represent the mean ± s.e.m. The number of neurons tested is shown in parentheses.

