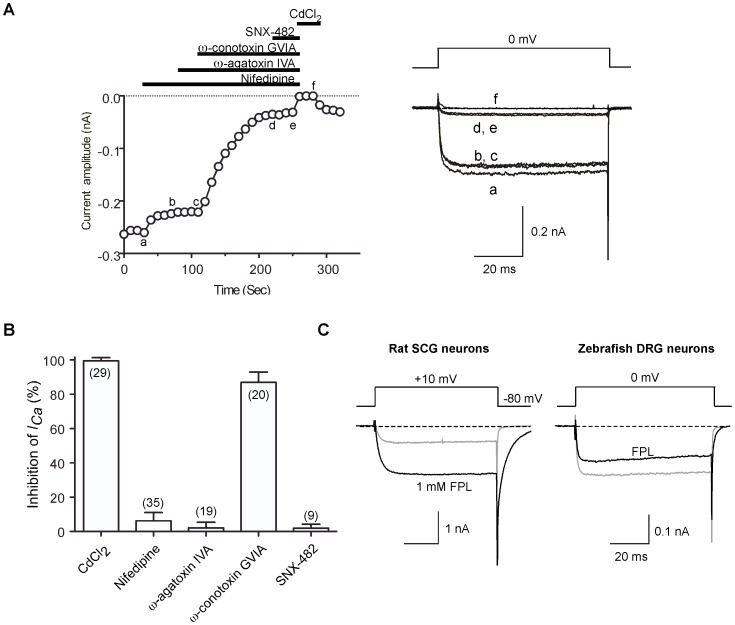
Figure 9. Pharmacological dissection of HVA-ICa in zebrafish DRG neurons.
A, Left, Time courses of ICa amplitude during serial application of nifedipine (10 µM), ω-agatoxin IVA (0.5 µM), ω-conotoxin GVIA (3 µM), SNX-482 (300 nM) and CdCl2 (100 µM). ICa was evoked every 10 s by 70 ms test pulses to 0 mV from a holding potential of −80 mV. The horizontal bars indicate the duration of drug application. Right, superimposed current traces obtained at different time points during drug application (labeled as a–f). B, Bar graph representing the mean ICa inhibition (%) produced by application of the indicated antagonists or toxins. Error bars represent s.e.m. The number of neurons tested is indicated in parentheses. C, Effect of non-dihydropyridine Ca2+ channel agonist FPL 64176 (FPL) on ICa in DRG neurons. FPL (1 µM) was applied to rat superior cervical ganglion (SCG) neurons as a positive control (left panel). Note that FPL applied to zebrafish DRG ICa display neither an increase in macroscopic inward currents nor greatly prolonged trajectory of the tail currents (right panel).

