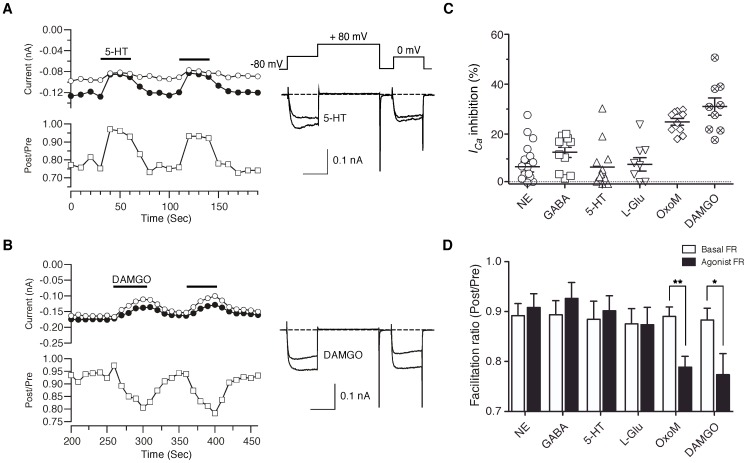
Figure 10. Modulation of HVA-ICa by neurotransmitters in zebrafish DRG neurons.
A–B, Time courses of ICa (left) and superimposed current traces (right) evoked with the double-pulse voltage protocol (inset on the traces in A) during application of 5-HT (10 µM) and DAMGO (1 µM), respectively. The ICa amplitude generated by the pre-pulse (filled circles) and post-pulse (open circles) are plotted. Facilitation ratio (FR) was calculated as the ratio of the post-pulse to pre-pulse ICa amplitude (open squares). The horizontal bars indicate the duration of drugs application. C, Dot plots represent inhibition of prepulse ICa (%) produced by application of norepinephrine (NE, 10 µM), GABA (100 µM), 5-HT, l-glutamic acid hydrochloride (l-Glu, 100 µM), oxotremorine M (OxoM, 10 µM) and DAMGO. D, Summary of the mean FR (Post/Pre) before (basal, open bars) or after (filled bars) application of agonists. Data are presented as mean ± sem. * P<0.05, ** P<0.001 by paired t-test.

