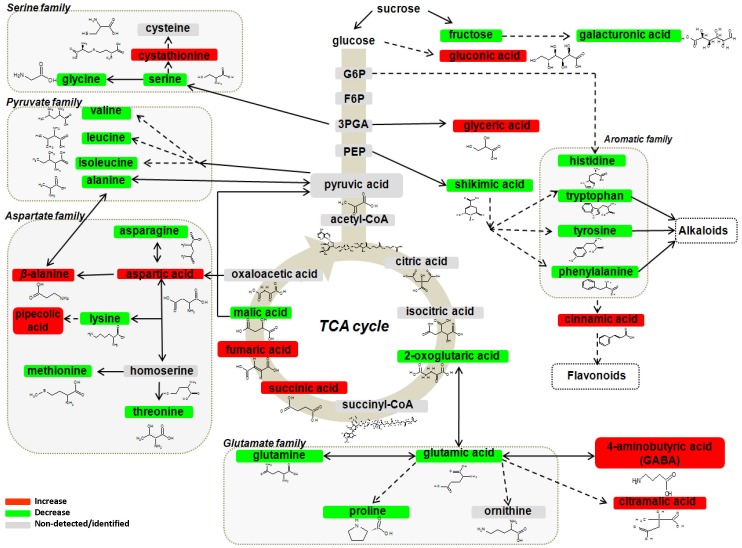
Figure 6. Changes in the protein and non-protein amino acid pools of infected Solanum tuberosum sprouts 72 h after infection with Rhizoctonia solani AG3.
Fluctuations in metabolite relative concentration are coded using a color code based on the means of scaled and centered PLS regression coefficients (CoeffCS) from eight replications. Dashed lines symbolize multistep or not fully elucidated reactions and solid lines one step reactions [3PGA; 3-phosphoglycerate, F6P; fructose-6-phosphate, G6P; glucose-6-phosphate, PEP; phosphoenolpyruvate].

