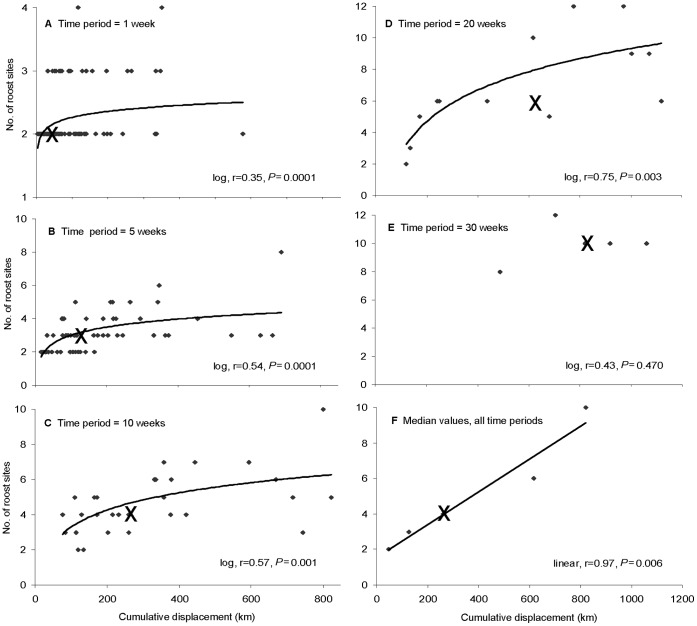
Figure 6. Number of roosts used by flying-foxes in relation to cumulative displacement during different time-periods.
A: 1 week (N = 132), B: 5 weeks (N = 55), C: 10 weeks (N = 29), D: 20 weeks (N = 13), E: 30 weeks (N = 5). ‘X’ shows the median of each dataset. F graphs the median values of each dataset. Cases where flying-foxes did not shift roosts during a time-period were excluded. Fitted lines show significant regressions (P<0.05), with either log or linear selected as the best fit based on Pearson’s r values. Note that the results in A were unaffected by removal of the isolated point at displacement of 600 km.

