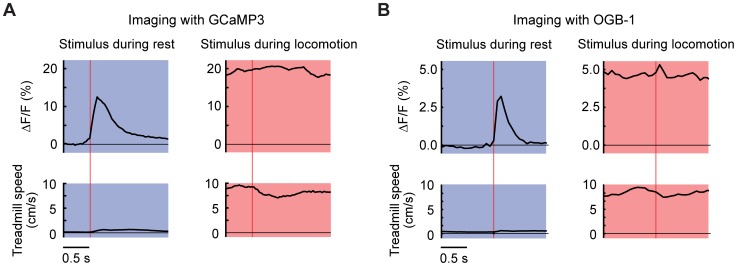
Figure 2. Locomotion-dependence of responses in imaged putative cerebellar granule cells.
(A) Averaged across all cells imaged using GCaMP3, stimulus-triggered fluorescence average in resting mice (top left) and during locomotion (top right). Bottom, treadmill speed averages. Vertical lines indicate stimulus time. (B) The same plots as in (A) for the responses obtained in experiments with OGB-1.

