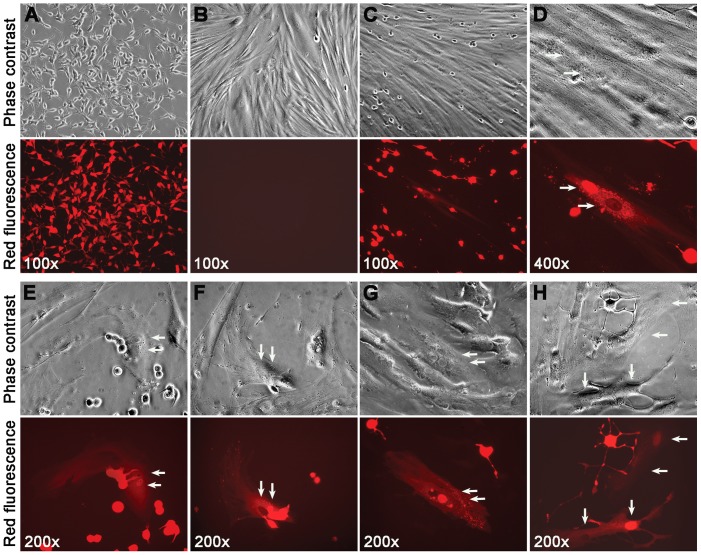
Figure 2. Characteristics of the spontaneous cancer-stromal cell fusion.
RL-1 cells (A) and HPS-15 cells (B) are shown in separate culture. After 7 days of co-culture, spontaneous fusion could be seen (C). At higher magnification, the fused cell contained two nuclei, one fluorescently red and the other fluorescently pale (D). Cancer-stromal fusion was frequently seen in areas where RL-1 and HPS-15 formed close contact (E). In some cases, cells in the middle of a fusion could be seen (F). The two nuclei could be seen close to each other (G) or separated (H). For each view, a phase contrast image (top) and red fluorescence image (bottom) are shown. Arrows are used to indicate nuclei.

