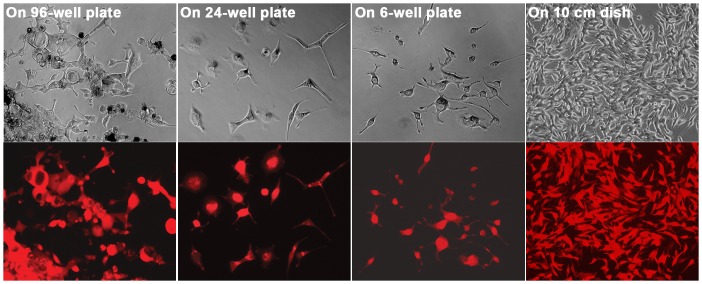
Figure 6. Morphologic changes in the derivative clones during colony formation.
The morphology of a derivative colony was followed during the cloning process, growing from a single well of a 96-well plate to a single well of 24-well plate, to a single well of a 6-well plate, and to a 10 cm dish. For each view, a phase contrast image (top) and red fluorescence image (bottom) are shown. All the images are shown at 100× magnification.

