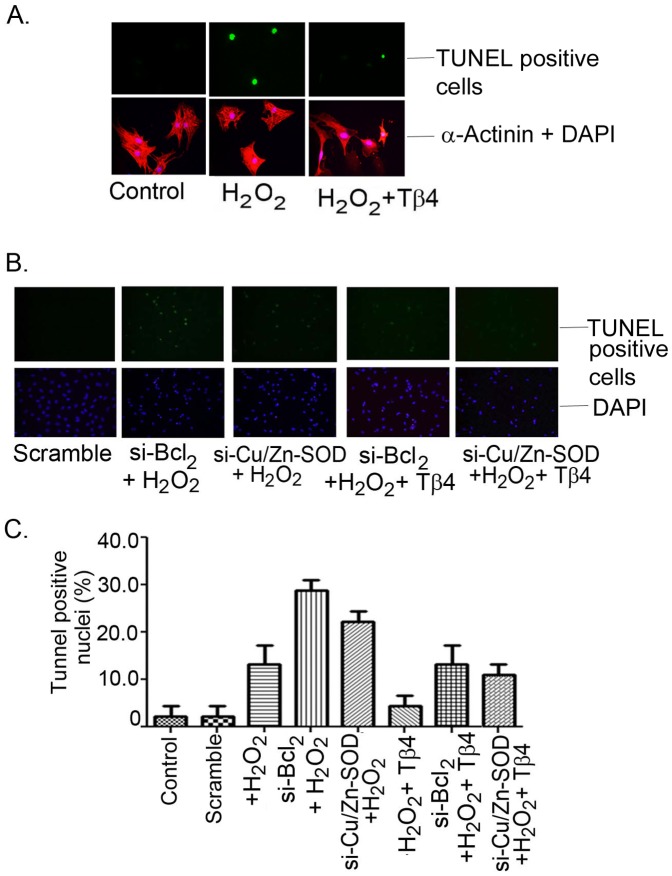
Figure 6. Representative fluorescent microscopy images of TUNEL staining in rat neonatal cardiomyocytes.
(A) Bright TUNEL-positive images from control, H2O2 treated and H2O2 treated but pretreated with Tβ4 (upper panel). The lower panel showed the images of corresponding DAPI stained with α-actinin, a myocyte specific marker protein. (B) Representative fluorescent microscopy images showed the effect of Tβ4 treatment in the presence and absence of H2O2-induced oxidative stress on cardiomyocytes transfected with si-RNA-Bcl2 and siRNA-Cu/Zn-SOD vs. scrambled siRNA, respectively (C) Bar graph shows the percent TUNEL-positive nuclei under similar experimental condition. Data represent the means ± SE of at least three separate experiments. A total of 45 to 65 nuclei were counted for each observation. * denotes p<0.05 compared to controls while # denotes p<0.05 compared to the H2O2-treated group with Tβ4 treated group.

