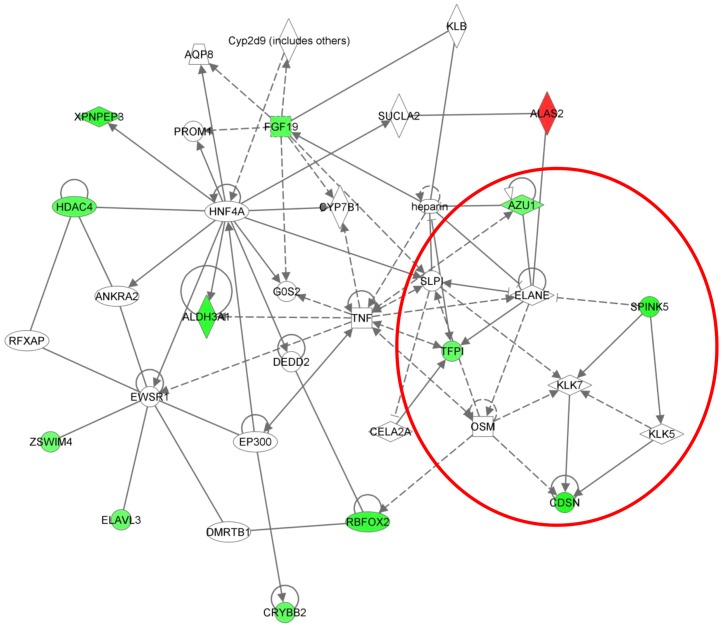
Figure 5. Graphical representation of genes within Cluster 4, Network 2, showing down-regulated expression across the 6 week time course.
Genes within the red circle are members of a sub-set within the network with defined roles in skin barrier function and are described further in the main text. Key: Individual nodes represent proteins with relationships represented by edges. Nodes coloured by gene expression, red indicating up-regulation, green indicating down-regulation and white indicating gene/factor not differentially expressed but with defined relationship to other genes in network. Arrows indicate directional relationships.

