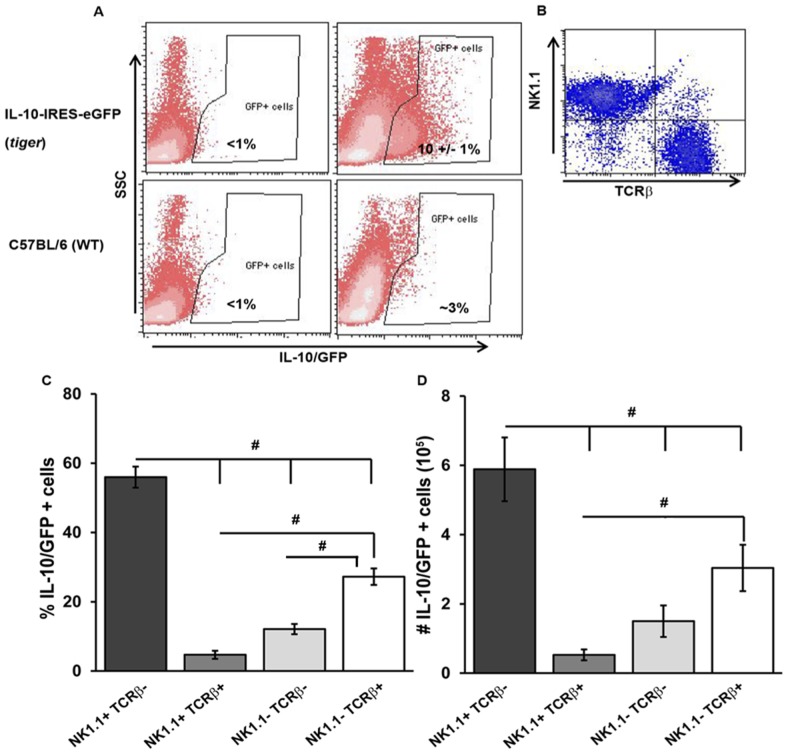
Figure 2. Characterization of IL-10 expressing cells in liver after MCMV infection.
Liver leukocytes were prepared from IL-10-IRES-eGFP reporter (tiger) mice that were left uninfected (D0) or infected with MCMV for 4 days (D4). (A) The gating strategy defining IL-10/GFP positive cells by flow cytometric analysis is shown. Representative plots show the proportions of IL-10/GFP+ leukocytes after FSC/SSC gating of leukocytes and gating on IL-10/GFP+ events in relation to side scatter. D0 and D4 infected C57BL/6J (WT) mice were included to control for background fluorescence. (B) Representative plot shows NK1.1 and TCRβ expression within total IL-10/GFP+ liver leukocytes in day 4 infected tiger mice. (C and D) The frequency and total numbers of IL-10/GFP+ populations are shown as the means ± SE and are combined data from three independent experiments (n = 11 mice total). The statistical differences between IL-10/GFP+ groups were determined by one way ANOVA, followed by Tukey's multiple comparisons post hoc test. “#” indicates a p value of ≤0.05. The following comparisons were significant: NK1.1+ TCRβ− vs. NK1.1+ TCRβ+, NK1.1− TCRβ−, NK1.1−TCRβ+ (frequency and numbers), NK1.1+ TCRβ+ vs. NK1.1− TCRβ+ (frequency and number), and NK1.1− TCRβ− vs. NK1.1− TCRβ+ (frequency only).

