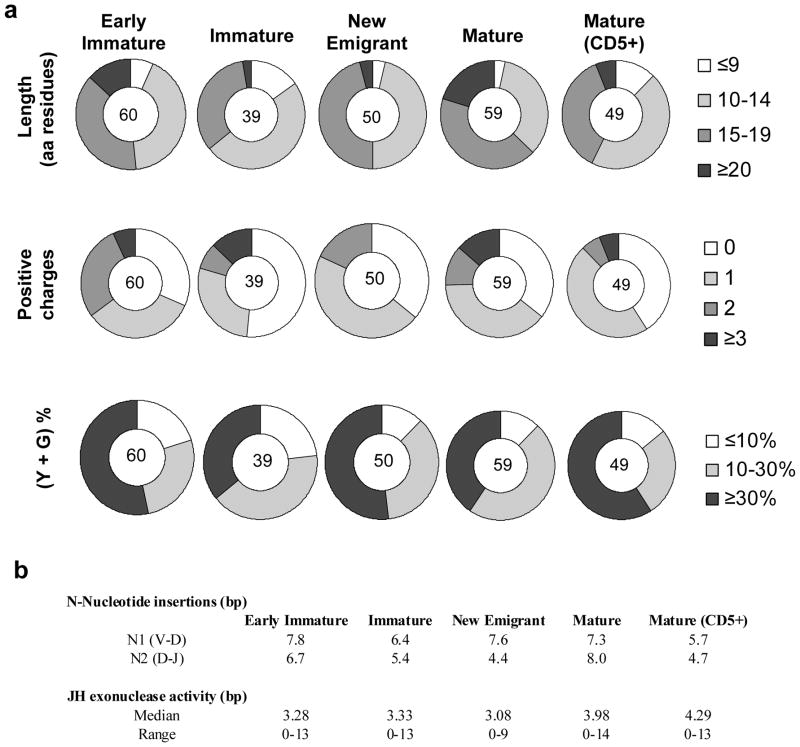
Figure 3.
Composition of the third complementarity region in the human immunoglobulin heavy chain (H-CDR3) regions. (a) The pie charts indicate length (amino acid residues) (upper panel), total positive charge content (middle) and percentage composition of total Y and G residues in each H-CDR3 region analyzed (lower). The different B-cell subpopulations from which the samples were derived are indicated above each pie chart. The number in the center of each pie chart indicates the total sample size for the particular B cell subset. (b) Average N-nucleotide insertions and JH exonuclease activity across the different B cell subsets are listed. All analyses were performed using the IMGT database.

