Figure 4.
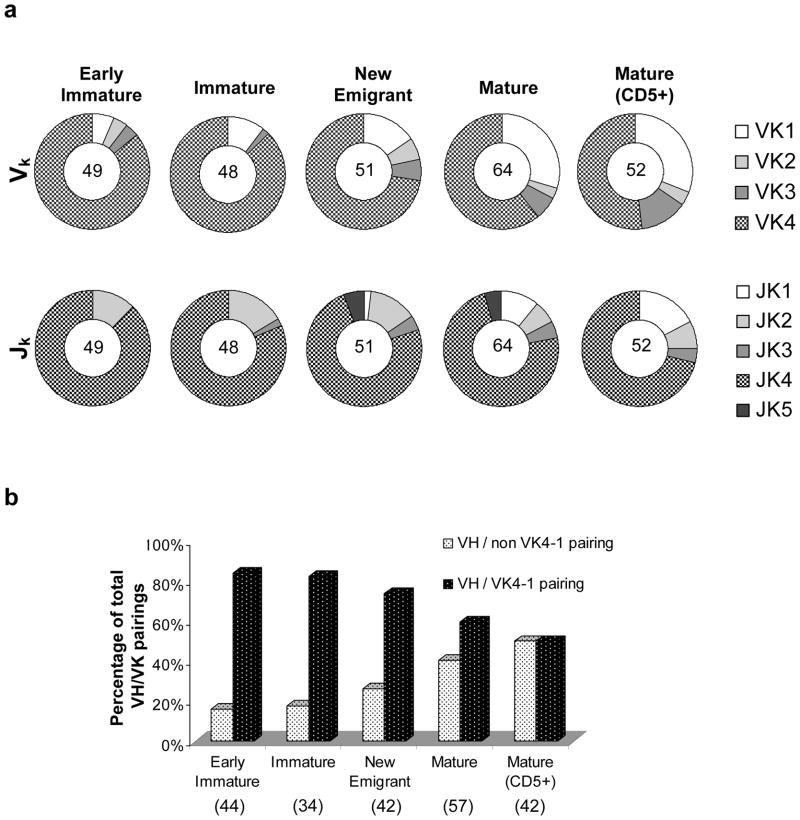
Analysis of the Vκ repertoire and VH- Vκ pairing in human B cells from hNSG mice. (a) The frequency of utilization of the different Vκ (upper panel) and Jκ (lower) gene families across the different B cell subpopulations as indicated above each pie chart is shown. The number in the center of each pie chart indicates the total sample size for the particular B cell subset. (b) VH-Vk pairs were classified into two groups – VH/non Vκ4-1 pairings and VH/Vκ4-1 pairings, their percentages over total number of VH-Vk pairing in a particular B cell subset were calculated and plotted as shown. A significant decrease in the incidence of VH/Vκ4-1 pairings (or conversely, an increase in VH/non Vκ4-1 pairings) was observed in the mature B cell subsets (CD5− and CD5+ subsets, combined) in comparison to the bone marrow derived B cell (early immature and immature subsets, combined) (Fisher’s Test, p<0.005).

