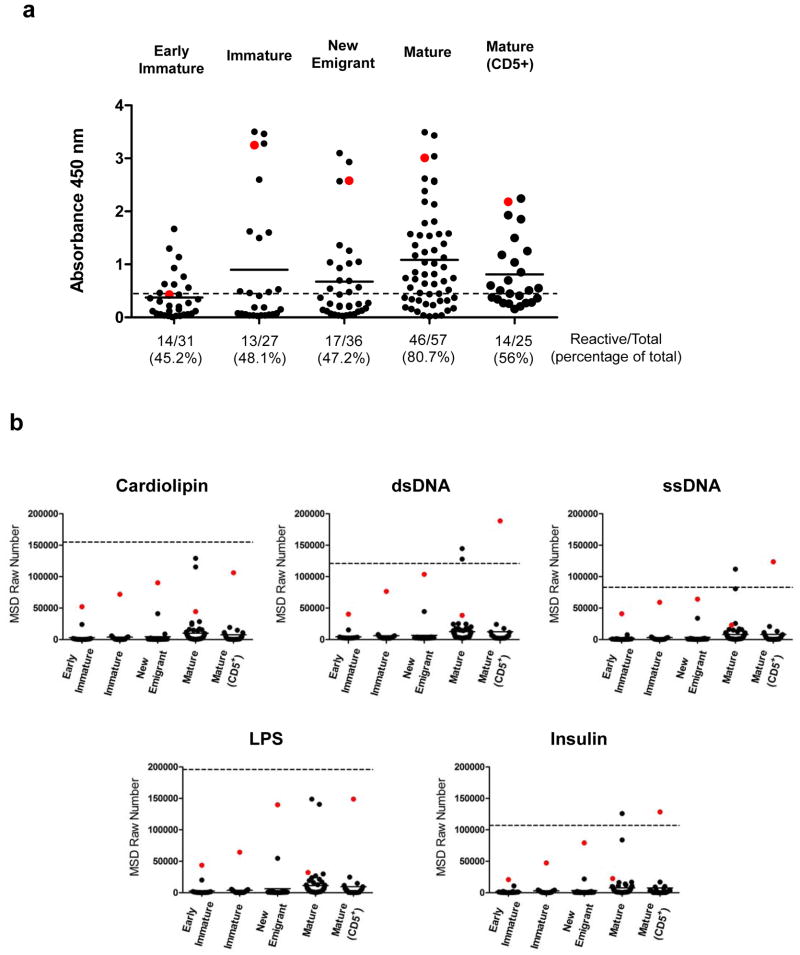
Figure 6.
Auto and polyreactivity analysis of the hNSG derived scFvFcs. (a) Hep-2 ELISA was performed with scFvFcs assembled and expressed from each B cell subset and that were purified from 293FT cell culture supernatants by Protein A chromatography. ELISA was performed using commercially available QUANTA Lite™ ANA ELISA plates. The assay was performed twice once with 50 μg/ml and repeated with 25 μg/ml of the scFvFcs. The horizontal dashed line represents the low positive control (manufacturer provided) cut-off and the numbers below each scatter plot represent the total number and percentage of the scFvFcs those were scored as reactive in the Hep-2 assay. Each dot represents a single scFvFcs, and the horizontal bar represents mean reactivity for each cell subset. A single scFvFc determined to be polyreactive (see Figure 6b) in each B cell subset has been color coded (red dot) for correlation between autoreactivity and polyspecificity. Autoreactivity was significantly higher in the mature B cell (median reactivity in Mature vs. Early immature/Immature/New emigrant and Mature CD5+ vs. Early immature/Immature/New emigrant, p<0.005). (b) Polyreactivity of the scFvFcs isolated from the different B cell subsets (indicated on the x-axis) was tested using the MSD platform. 384-well plates were coated with the different antigens as listed above each plot. scFvFcs were tested at a concentration of 5 μg/ml, and all samples were tested in duplicates. The mean value in MSD raw numbers (y-axis) as obtained in the MSD Sector Imager was plotted. 4E10 scFvFc was used as positive control represented as the horizontal dashed line in each plot and readings obtained with PBS binding to antigen coated wells was considered as background. Each dot represents the binding of individual scFvFcs, and the horizontal bar represents mean reactivity for each cell subset. A single scFvFc in each B cell subset was color coded (red dot) for correlation of polyspecificity across different antigens. Polyspecificity was significantly higher in the mature B cell subsets (median reactivity in Mature vs. Early immature/Immature/New emigrant and Mature CD5+ vs. Early immature/Immature/New emigrant, p<0.005). Differences in median reactivity between the scFvFcs of each B cell subset were calculated using the Mann-Whitney unpaired t-test.

