FIGURE 2.
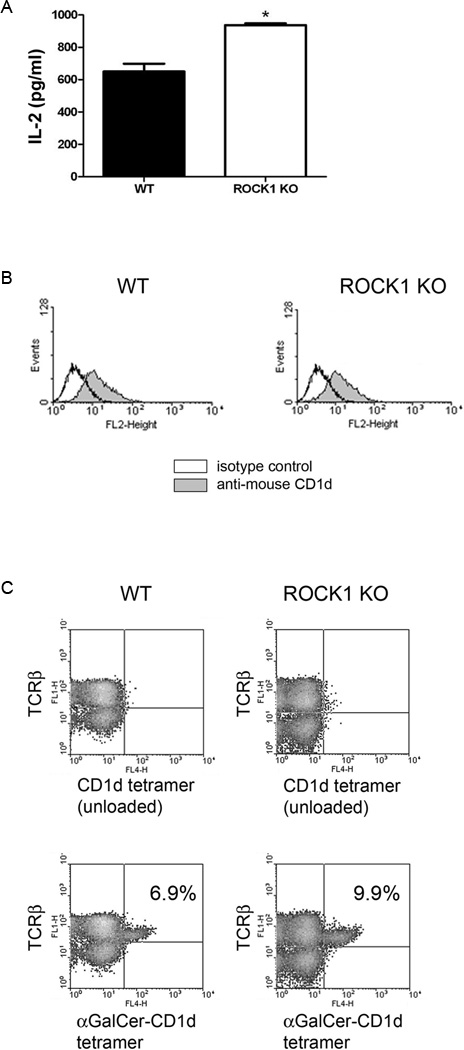
Enhanced CD1d functional expression and NKT cell numbers in ROCK1 KO mice. A, Bone marrow-derived dendritic cells (BMDCs) from control (WT) and ROCK1 KO mice were co-cultured with the representative N37-1A12 NKT cell hybridoma; *, P = 0.0043. B, BMDCs from WT and ROCK1 KO mice were stained for surface CD1d and analyzed by flow cytometry. C, Liver mononuclear cells from WT and ROCK1 KO mice were harvested and NKT cells were identified by flow cytometry [TCRβ+/α-GalCer (PBS-57)-loaded CD1d tetramer+]. The percentage of NKT cells is shown in the upper right quadrant of the lower two-color plots. The experiments shown are representative of two performed. Two mice per group were analyzed in each experiment.

