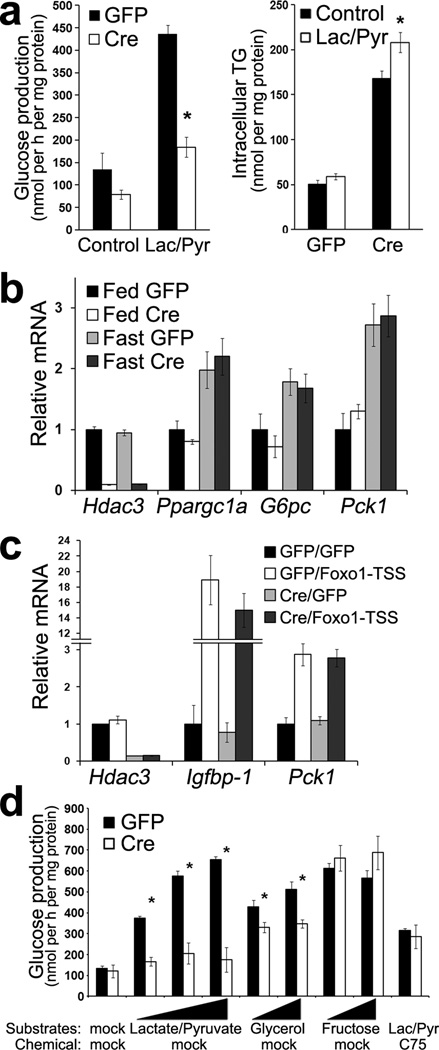
Figure 5. Reduced hepatic glucose production in Hdac3-depleted liver is a result of the metabolic rerouting, rather than due to inherent defects of gluconeogenesis.
(a) Glucose production in primary hepatocytes isolated from AAV-injected mice after overnight fasting. Cells were incubated with Krebs buffer supplemented with or without 10 mM lactate (Lac) and 1 mM pyruvate (Pyr) for 2 h. The generated glucose was determined. Cells were harvested and intracellular triglyceride was extracted and measured. (b) RT-qPCR analysis of liver from mice at 2-weeks since AAV injection after either fed or fasted for 12 h from 7 p.m. to 7 a.m. n = 3. (c) RT-qPCR analysis of liver. At 9 d after AAV injection, mice were injected with adenovirus expressing either GFP or Foxo1-TSS (T24A, S256A, S319A). After another 5 d, mice were fasted for 12 h (7 p.m. −7 a.m.) and then refed for 6 h followed by tissue harvest. n = 4. (d) Glucose production in primary hepatocytes. Lac/Pyr were added together at 2 mM /0.2 mM, 10 mM /1 mM, 30 mM /3 mM; glycerol and fructose was added individually at 10 mM and 25 mM. Lipid synthesis inhibitor C75 was used at 5 ug ml−1. n = 3. Error bars indicate s.e.m. * P < 0.05 between Cre and GFP groups.

