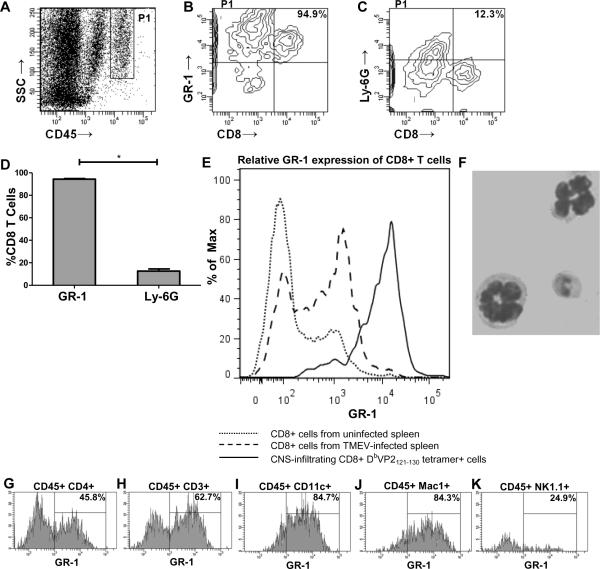
Figure 1. The anti-granulocyte receptor-1 (GR-1) mAb RB6-8C5 binds to CD8+ cells.
Contour plots from a representative TMEV-infected C57BL/6 mouse administered VP2121-130 peptide to induce PIFS (n=8). (A) The CD45hi population was gated and analyzed for the percentage of CD8+ cells that also express GR-1 or Ly-6G. (B) The majority of brain-infiltrating CD8 T cells also stain positive for GR-1 protein. (C) The vast majority of CD8 T cells are negative for Ly-6G protein. (D) Bar graph showing the significant difference in the percentage of brain-infiltrating CD8+ cells that express either GR-1 or Ly-6G protein (p<0.001 by Student's t-test). Error bars indicate standard error of the mean (SEM). Shown are the results of one experiment representative of two. (E) CNS-infiltrating DbVP2121-130 epitope-specific CD8+ cells isolated from TMEV-infected C57BL/6 mice administered VP2121-130 peptide to induce PIFS (n=8) express high levels of GR-1 protein when compared to CD8+ cells isolated from the spleen of uninfected (n=3) (p<0.001 by Student's t-test) or intracranially TMEV-infected (n=6) (p<0.001 by Student's t-test) C57BL/6 mice. (F) Magnetically sorted brain-infiltrating Ly-6G+ cells have morphological features consistent with neutrophils (i.e. segmented nuclei). Brain-infiltrating (G) CD4+, (H) CD3+, (I) CD11c+, (J) Mac-1+, and (K) NK1.1+ cells isolated from TMEV-infected C57BL/6 mice induced to undergo PIFS (n=4) were analyzed as a percentage of CD45hi cells for expression of GR-1 protein. The vast majority of (H) CD3+, (I) CD11c+, and (J) Mac-1+ cells express GR-1 protein, while approximately half of (G) CD4+ cells and a quarter of (K) NK1.1+ cells express GR-1 protein. Percentages are indicated in the upper right-hand corner of the histograms.

