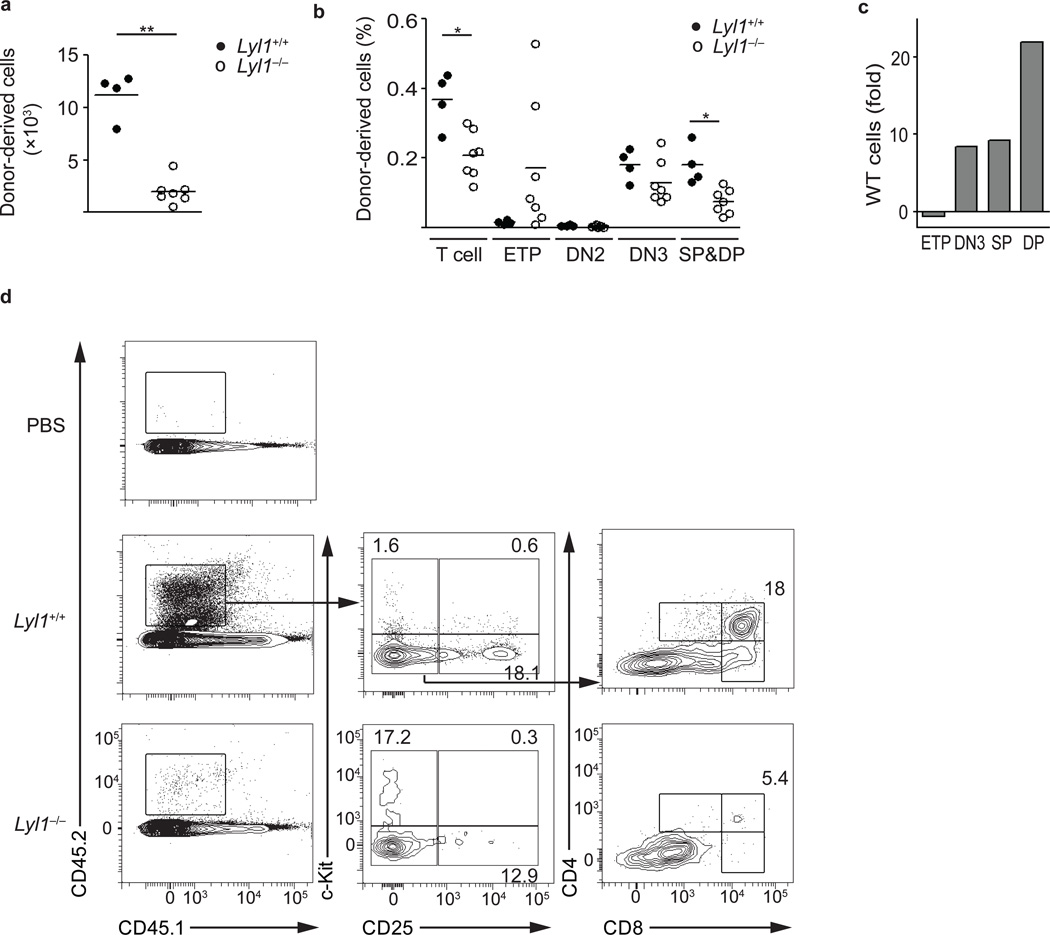
Figure 4. In vivo T-lineage potential of Lyl1−/− LMPPs by intrathymic transplantation.
10,000 wild-type and Lyl1−/− LMPPs were sorted and transplanted by intrathymic injection into non-irradiated recipients. Thymuses were harvested at day +9 after transplantation and analyzed for T-lineage output by flow-cytometry. Shown are the combined of two independent experiments. Bars indicate the mean; * indicates p<0.01 and ** indicates p<0.001. (a) Absolute number of donor (CD45.2) cells recovered after intrathymic transplantation. (b) Distribution of donor T-lineage cells listed as a fraction of total thymic donor cells. T-lineage cells comprise the populations DN3, single positive (SP) CD4, SP CD8 and double positive (DP). (c) Fold increase of thymocyte population by absolute cell number after injection of wild-type compared to Lyl1−/− LMPPs. (d) Representative stains and gating strategy for intrathymic analysis. Numbers shown in representative plots are listed as percentage of total thymic donor cells.

