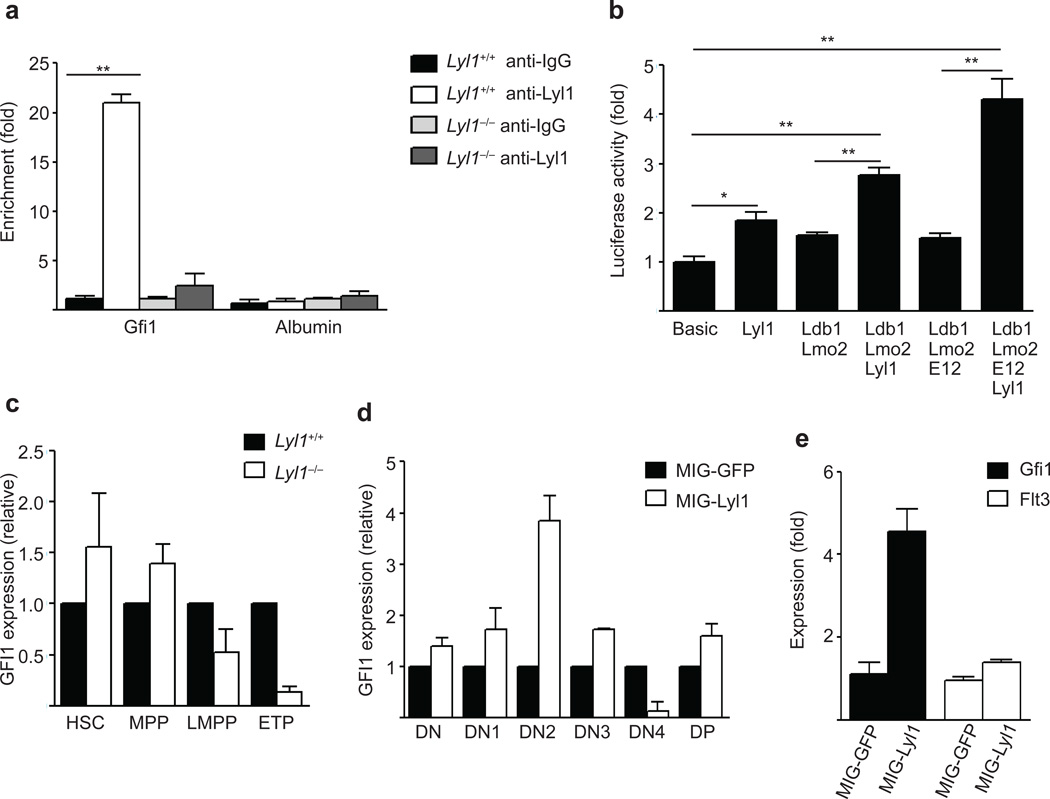
Figure 6. Gfi1 is directly regulated by Lyl1.
(a) ChIP assay in c-kit positive BM cells from wild-type and Lyl1−/− mice revealed strong binding of Lyl1 at the 35kb Gfi1 enhancer region in-vivo. are representative of 2–4 independent experiments. Quantitative PCR data are presented as means ± SD. (b) Luciferase activity of a pGL3 Gfi1 (−35kb) promoter reporter construct in 293T cells after transfection with control, Lyl1, Lmo2, Ldb1 and E12 expressing plasmids. are representative of 3 independent experiments. Data are presented as means ± SD (c) Quantitative PCR analysis of Gfi1 mRNA expression in sorted wild-type and Lyl1−/− HSCs, MPPs, LMPPs and ETPs. Data are representative of two experiments comprising 4 independently sorted populations for each subset. All samples were analyzed in triplicate, data are presented in mean ± SD. (d) Quantitative PCR analysis of Gfi1 mRNA expression in sorted GFPpos thymocyte populations (DN, DN1, DN2, DN3, DN4 and DP) 12 weeks after injection of MIG-GFP or MIG-Lyl1 transduced Lyl1−/− BM progenitors. Data are representative of two experiments comprising 4 independently sorted populations for each subset. Samples were analyzed in triplicate and presented as mean ±SD. (e) Quantification of Gfi1 and Flt3 mRNA transcripts in wild-type BM progenitors 36 hours after transduction with MIG-GFP (control) or MIG-Lyl1. Data are representative of three experiments and a total of 6 samples per group (mean ± SD). (a–e) * indicates p<0.01, ** indicates p<0.001.

