Figure 3.
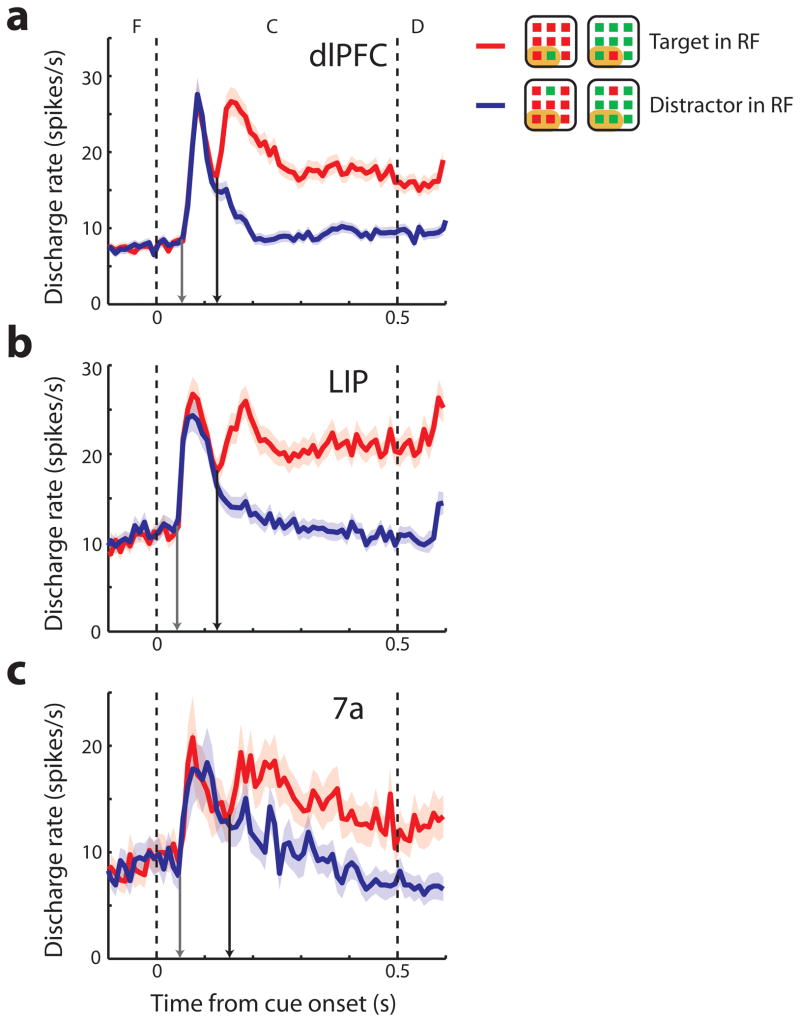
Population firing rate. a–c. Average discharge rates from dlPFC (N=278), LIP (N=187), and area 7a (N=71) respectively. Peri stimulus time histograms are plotted with mean discharge rate elicited during presentation of target in the receptive field (RF) and distractor in the receptive field conditions over fixation (F), cue (C), and delay (D) period. Shaded area represents standard error of the mean discharge rate. The dotted vertical lines illustrate the time of cue onset and offset. Gray arrows in each panel indicate the population visual response latency; black arrows, the population time of neuronal target discrimination. Insets are schematic illustrations of stimulus condition in or out of the receptive field; each neuron’s receptive field was located at a different position.

