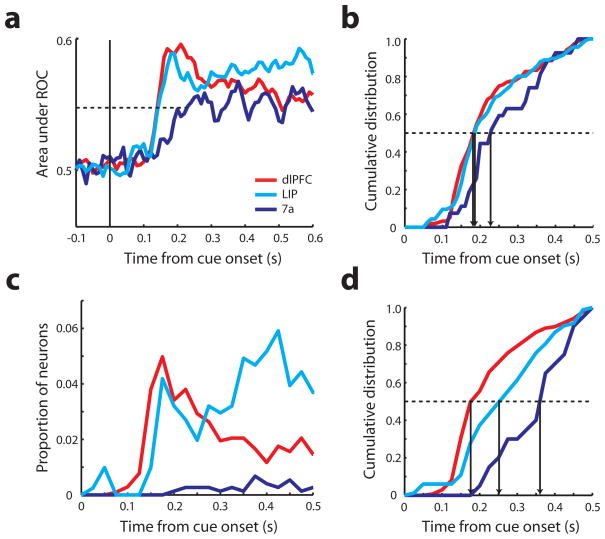
Figure 4.
Receiver operating characteristic (ROC) analysis and mutual information analysis. a. Area under the ROC curve is plotted as a function of time. Solid vertical line represents the time of cue onset. Dotted line indicates the average mid-point between the peak and baseline of recorded neurons irrespective of area. Red, cyan, and blue curves represent dlPFC (N=278), LIP (N=187), and area 7a (N=71) respectively. b. Cumulative distribution of neurons with significant area under the ROC curve. Each vertical arrow indicates the time point when 50% of neurons of an area reached significance (dlPFC: N=170, LIP: N=114, 7a: N=31). c. Proportion of neurons with significant mutual information as a function of time. Total sample size, dlPFC: N=793, LIP: N=406, 7a: N=485. d. Cumulative distribution of neurons that represented significant mutual information (dlPFC: N=137, LIP: N=83, 7a: N=20). Vertical arrow indicates the time point when 50% of neurons in an area reached statistical significance.

