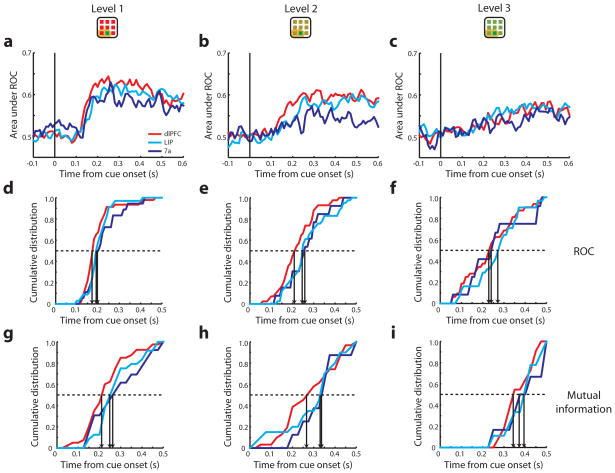
Figure 8.
ROC and mutual information analysis for responses in the difficult-discrimination task. a–c. Average ROC values obtained from three levels of difficulty, respectively. Vertical lines illustrate the time of cue onset. d–f. Cumulative distribution of neurons with significant area under the ROC curve. g–i. Cumulative distribution of neurons that represented significant mutual information. Each vertical arrow indicates the time point when 50% of neurons in an area reached significance.

