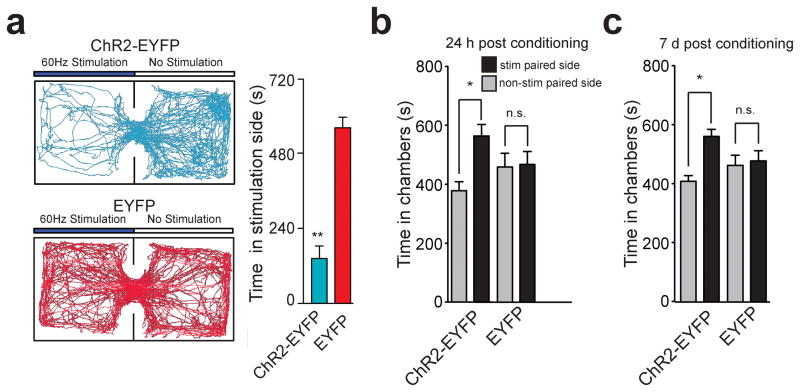
Figure 2. Activation of LHb inputs to the RMTg produces behavioral avoidance.
(a) Left: Real-time place preference location plots from two representative mice showing the animal’s position over the course of the 20-min session. Right: ChR2-EYFP-expressing mice spent significantly less time on the stimulated-paired side (t(10) = 7.90, p < 0.0001). n = 6 mice/group for real-time place preference. (b) ChR2-EYFP-expressing mice spent significantly less time in the stimulation-paired chamber compared to the non-stimulation-paired chamber 24 hrs after the last stimulation conditioning session (t(7) = 3.54, p = 0.01). EYFP-expressing did not show a preference (t(7) = 0.57, p = 0.58). (c) ChR2-EYFP-expressing mice spent significantly less time in the stimulation paired chamber compared to the non-stimulation-paired chamber 7 days after the last stimulation session (t(7) = 3.24, p = 0.01). EYFP-expressing mice did not show a preference (t(7) = 0.17, p = 0.86). n = 8 mice/group for conditioned place preference.

