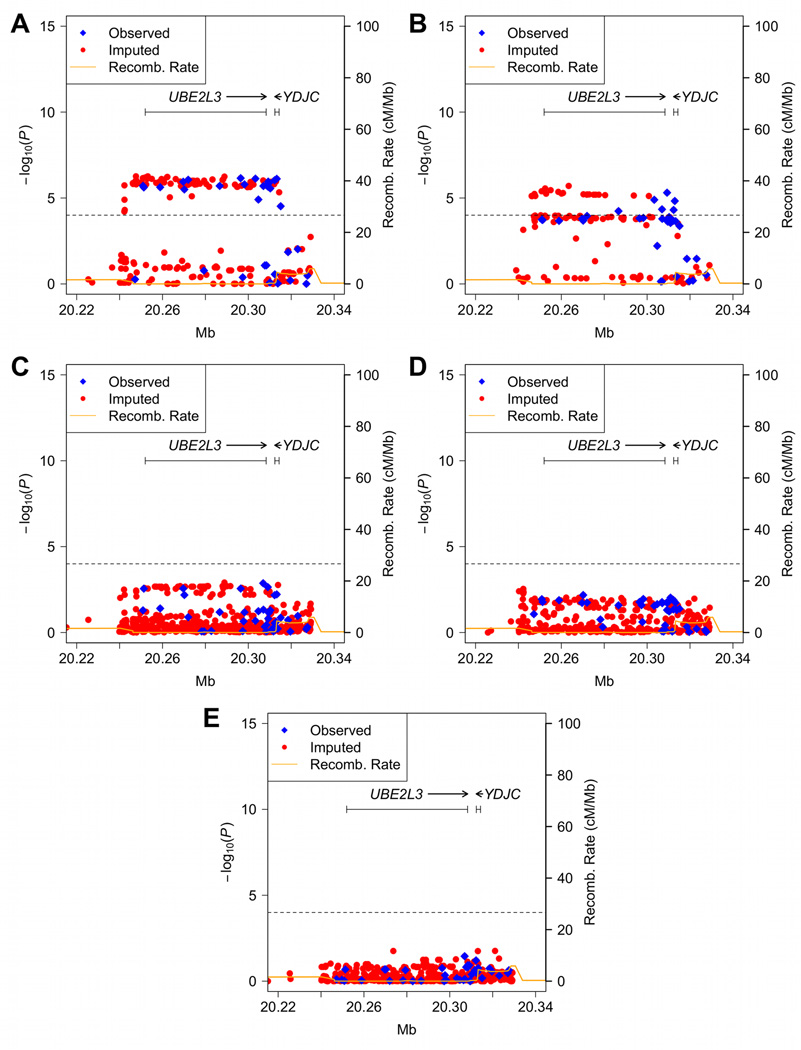
Figure 1.
SNPs in and around the UBE2L3 region associated with SLE. (A) European-ancestry, (B) Asian, (C) African American, (D) Hispanic and (E) African-American Gullah populations. The dashed line in each panel signifies the Bonferroni corrected level of significance (P = 1 × 10⁻⁴). The orange solid line denotes the recombination rate calculated from the combined HapMap CEU, YRI and CHB+JPT data.

