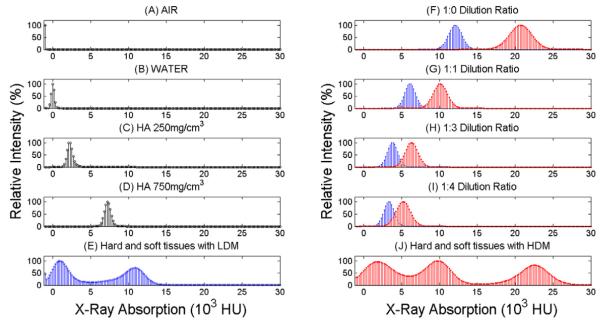
FIGURE 1.
On the left side, histograms of X-ray absorption in Hounsfield Units for A) air, B) water, C) 250mg/cm3 HA phantom, D) 750g/cm3 HA phantom. On the right side, histograms represent F) 1:0 LDM and HDM dilutions G) 1:1 LDM and HDM dilutions, H) 1:3 LDM and HDM dilutions, I) 1:4 LDM and HDM dilutions. Bottom row indicates histograms of VOI of Knee joint for E) soft and hard tissues injected with 1:0 LDM, and J) soft and hard tissues injected with 1:0 HDM.

