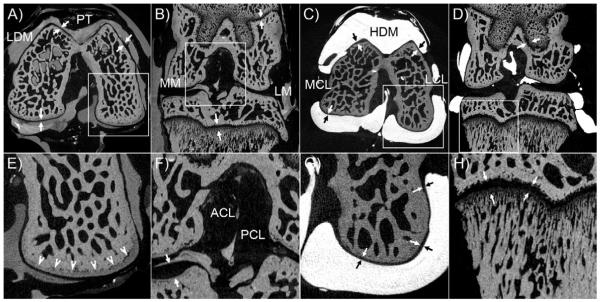
FIGURE 2.
Contrast enhanced μCT images of a rat knee joint at 2.7μm voxel size. A) Transverse plane of 1:0 LDM scan indicating the Patellar Tendon (PT) and femoral cartilage (arrows); inset in panel A showing subchondral bone is magnified in panel E. B) Coronal plane showing the Medial Meniscus (MM), Lateral Meniscus (LM); and femoral and tibial growth plate; inset in panel B showing a magnified view of Anterior Cruciate Ligament (ACL), Posterior Cruciate Ligament (PCL) and tibial cartilage (arrows) in panel F. C) Transverse plane of a 1:0 HDM scan showing the Lateral Collateral Ligament (LCL), Medial Collateral Ligament (MCL) and femoral cartilage (arrows); inset in panel C displaying a magnified view of femoral cartilage, subchondral bone and microfil interface in panel G. D) Coronal plane of a 1:0 HDM scan indicating the Posterior Cruciate Ligament (arrows) and femoral growth plate; inset in panel D showing a magnified view in greater detailed of tibial trabecular bone and growth plate subchondral bone in panel H (arrows).

