Fig. 1.
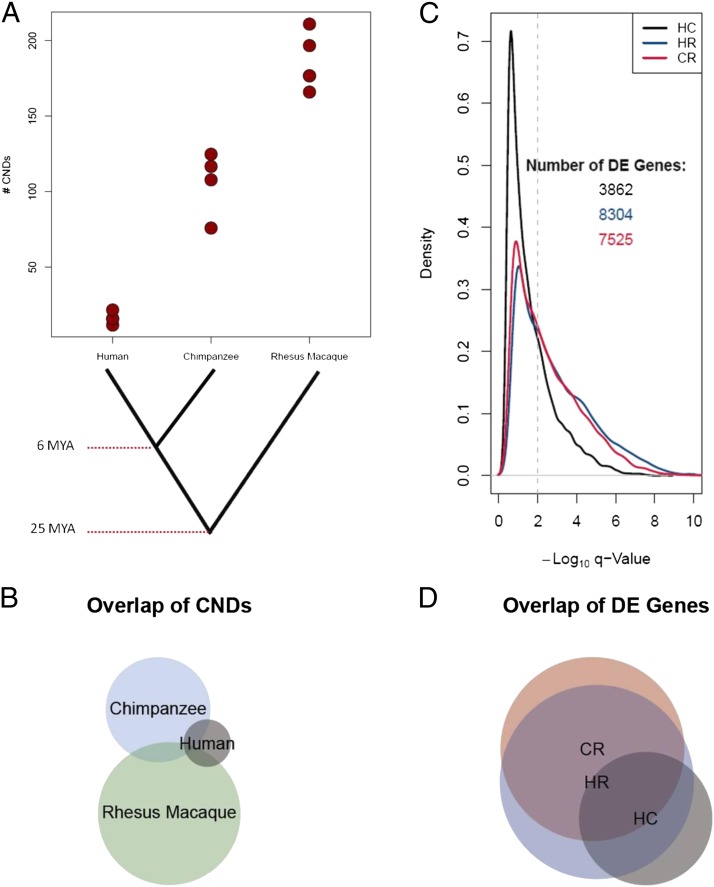
Copy number and gene expression levels differ between primate species. (A) The number of CND calls per sample. Detailed calling parameters are provided in SI Materials and Methods. Note the increase in the number of CND calls with the increased genetic distance from the human reference DNA (NA10851). Eighteen of the 33 CNDs found in human samples were previously known CNVs among humans. (B) Shared CNDs among species using a 50% reciprocal overlap criterion. (C) Density plot of the –log10 q-values for pairwise comparisons of species for DE genes by using RNAseq data. RNAseq read depth was used to determine the probability of each of ∼14,000 genes being DE between pairs of species: HC, HR, and CR. The vertical dashed line is a cutoff of q-value of 0.01 (FDR of 1%). All genes to the right of that line are considered to be DE for that pairwise comparison in subsequent analyses. Note how the red and blue lines (HR and CR) remain above the black line to the right of the significance level cutoff, indicating more DE genes in these pairwise comparisons. (D) Overlap of DE genes for each pairwise comparison (using an FDR of 1%).

