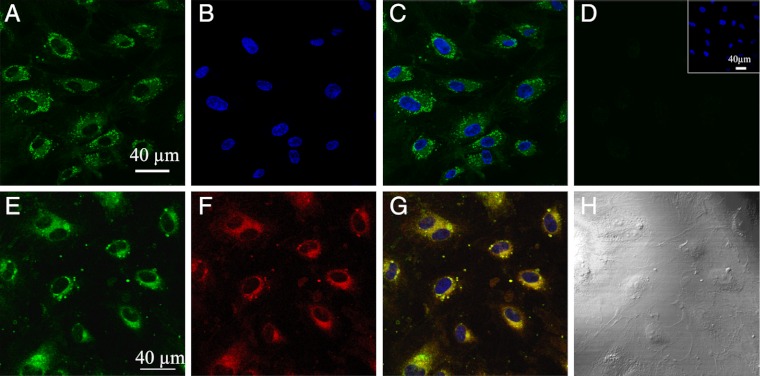
Fig. 4.
Imaging of living HUVECs using the two-photon fluorescence properties of NS1 and colocalization with the Golgi complex. HUVECs were treated with 5 μM NS1 and further observed under 2-PE (840 nm; emission at 520–680 nm) (A); (B) nucleus staining of NS1-treated HUVECs (2-PE, 740 nm; emission at 410–510 nm) by Hoechst 33342; (C) merged image of A and B; (D) control two-photon image of nontreated HUVECs at the same setting (Inset, nucleus staining of control cells); (E–H) colocalization imaging of NS1 and the Golgi complex—living HUVECs were treated with NS1 (5 μM) and Golgi tracker (BODIPY TR ceramide; 5 μM) for 60 min. (E) Shows the imaging channel of NS1 (1-PE, 488 nm; emission at 520–680 nm). (F) Shows the imaging channel of the Golgi tracker (1-PE, 543 nm; emission at 600–650 nm); (G) merged image of E and F (with nucleus staining). Yellow areas indicate colocalization of NS1 and the Golgi apparatus; (H) shows the corresponding differential interference contrast microscopy transmission image. Colocalization experiments with ER, mitochondria, and EEA1 are shown in SI Appendix, Fig. S10.

