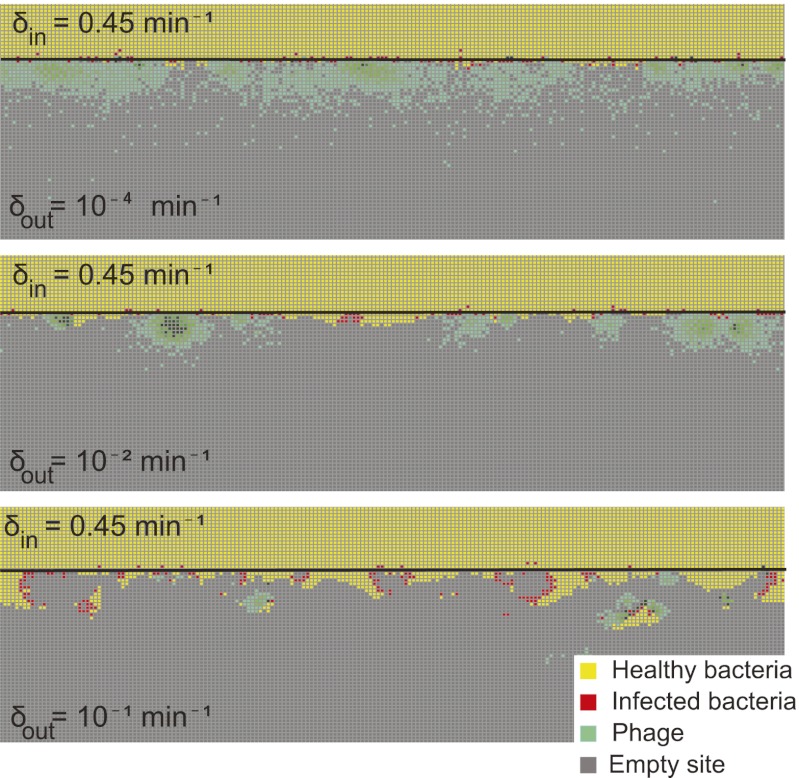
Fig. 2.
Snapshots of fixed bacterial refuge simulations. The plane is divided into two halves. The upper part is a bacterial refuge where phage cannot sustain themselves for long because of a high phage degradation rate. The three snapshots show simulations with three different  values in the lower part of the system. The
  value in the upper part of the system (the bacterial refuge) is kept constant at
  . Grid size: 150 × 150. Initial conditions: upper plane was filled with uninfected bacteria and one line of infected bacteria was placed on the boundary between the two halves. (Top)
  . (Middle)
  . (Bottom)
  .
.

