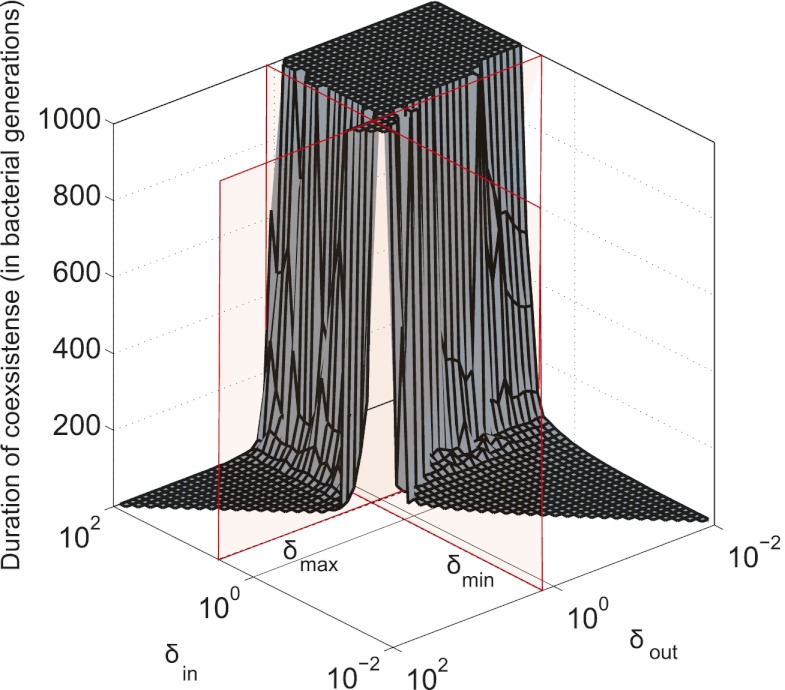
Fig. 5.
Long-lived coexistence for a broad range of  and
and  . Shown is duration of coexistence as a function of
  and
and  (
( ). Red lines mark
  and
and  for
for  in the basic model. If time reached 1,000 bacterial generations while there was still coexistence (i.e., both phage and bacteria were present), then the simulation was stopped. Only parameter sets where
  were considered. Within the region where
  and
and  the phage and bacteria coexisted for durations much longer than the bacterial generation time. In this region, the average infection front speeds were also relatively low (SI Appendix). When
  and
and  , the phage live for a short time on the edge of the expanding bacterial colony before dying out. When
  and
and  , the phage infection fronts rapidly eat into the colonies and eventually wipe out the bacteria. In the small region where both
  and
and  are within the narrow range of
  , there is stable coexistence. Grid size: 100 × 100. Initial conditions: upper half-plane filled by uninfected bacteria and a single line of infected bacteria on the boundary between the upper part and the empty lower half-plane.

