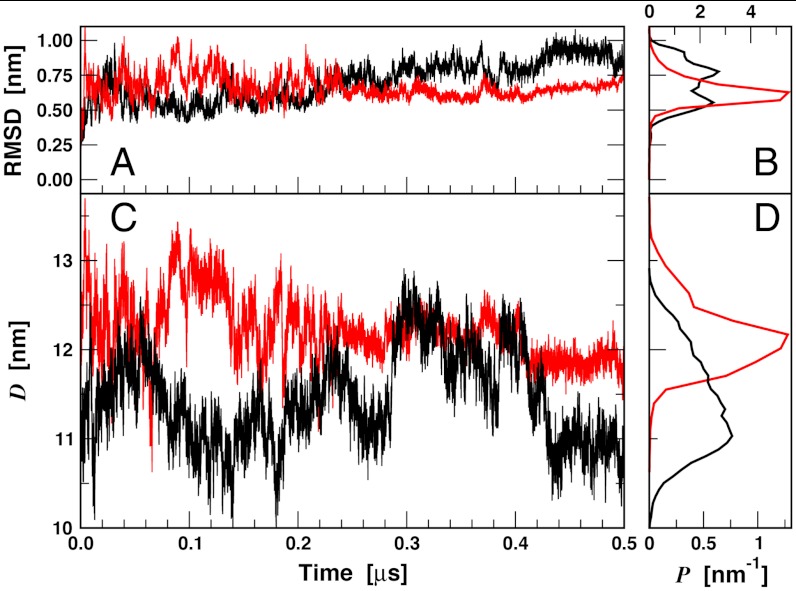
Fig. 2.
Molecular dynamics of the LSD1/CoREST nanoscale clamp in solution along the 0.5-μs unbound (black lines) and H3-histone-bound (red lines) trajectories. (A) Time series of LSD1/CoREST backbone Cα atom-positional rmsd from the starting reference X-ray structures and (B) corresponding normalized probability distributions. (C) Time series of the SWIRM–SAINT2 interdomain distance, D, and (D) corresponding normalized probability distributions.

