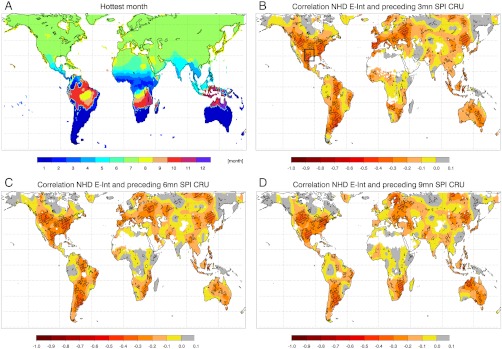
Fig. 1.
Relation between number of hot days (NHD) in hottest month of each year and preceding precipitation deficits (SPI). (A) Geographical distribution of most frequent hottest month. (B) Correlations of NHD in hottest month with 3-month, (C) 6-month, and (D) 9-month SPI in preceding month. All maps have been smoothed with a boxcar filter of width 10. Significant levels (90%) are not smoothed (hatched). White areas indicate missing values. The employed datasets are ERA-Interim (E-Int) for NHD and CRU for SPI.

