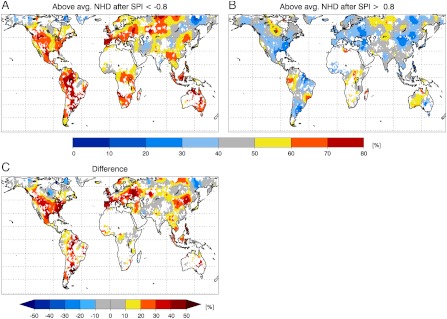
Fig. 4.
Hot day occurrence probability after dry versus wet conditions. Occurrence probability for above-average number of hot days in the respective hottest month of each year following low 3-month SPI values (dry conditions, A) and high 3-month SPI values (wet conditions, B), and difference between the two (C). Values are given in percentage of years with above-average NHD from total number of low and high SPI years, respectively. Values that are based on a composite of less than 4 years are not shown (white areas). The employed datasets are ERA-Interim for NHD and CRU for SPI.

