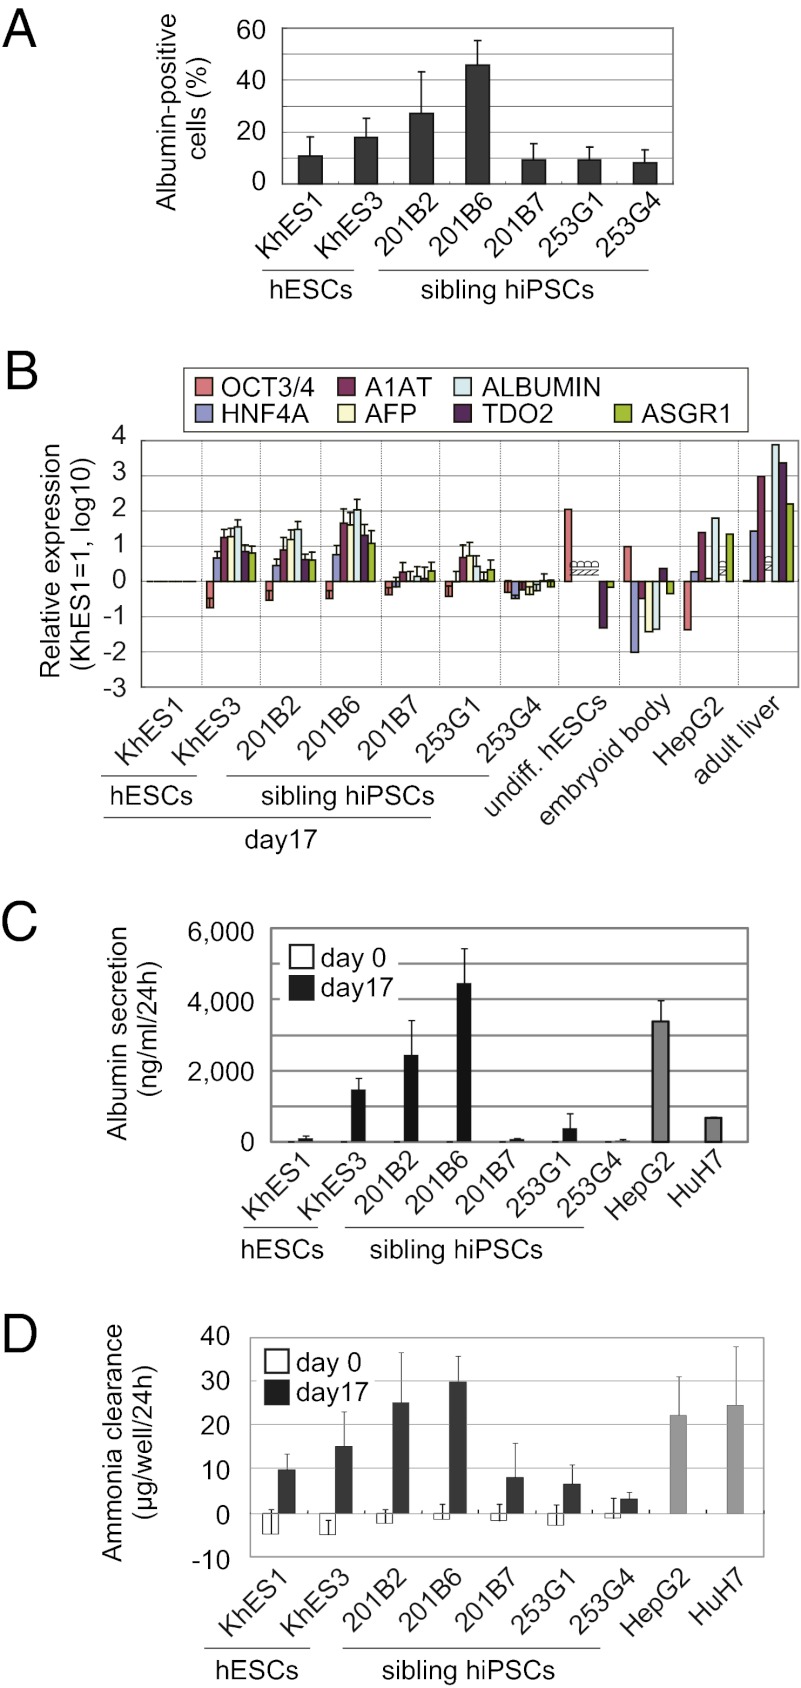
Fig. 2.
Diverse hepatic differentiation among hiPS/ESC clones. (A) Percentage of albumin-positive cells detected by a flow cytometric analysis after 17 d of hepatic differentiation. (B) Real-time PCR analysis of liver-related and undifferentiated gene expression in the hepatic differentiated hiPS/ESCs on day 17. The graph represents the fold expression of genes relative to KhES1 on day 17. ND, not determined. (C) Albumin secretion potential of the undifferentiated (day 0) and hepatic differentiated hiPS/ESCs on day 17 as determined by an ELISA. (D) Comparison of the ammonia clearance activity of the undifferentiated (day 0) and hepatic differentiated hiPS/ESCs on day 17. Error bars indicate the SD (n = 3).

