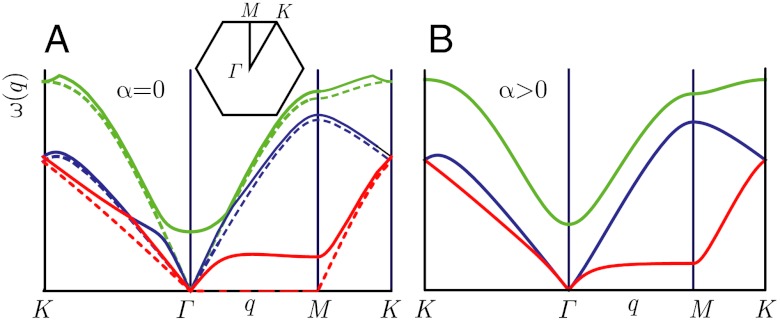
Fig. 3.
(A) Phonon spectrum for the undistorted kagome lattice. Dashed lines depict frequencies at k′ = 0 and full lines at k′ > 0. The inset shows the Brillouin zone with symmetry points Γ, M, and K. Note the line of zero modes along ΓM when k′ = 0, all of which develop nonzero frequencies for wavenumber q > 0 when k′ > 0 reaching  on a plateau beginning at
  defining a length scale l∗ = 1/q∗. (B) Phonon spectrum for α > 0 and k′ = 0. The plateau along ΓM defines
  and its onset at qα ∼ ωα defines a length lα ∼ 1/| sin α|.

