Fig. 3.
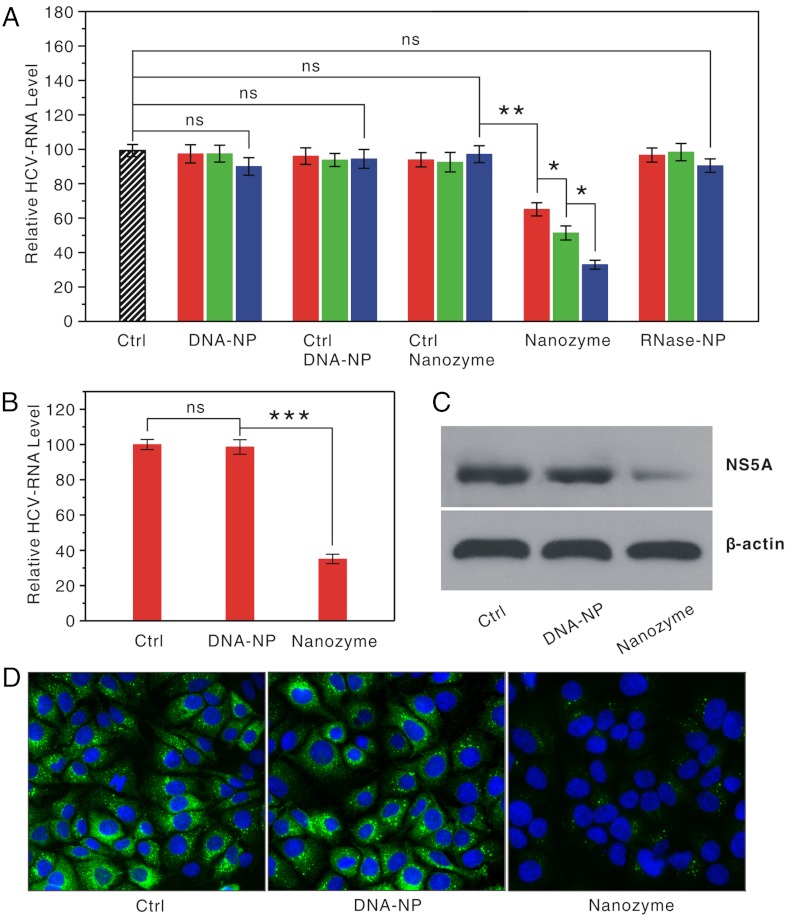
Anti-HCV effects of the anti-HCV nanozyme in FL-Neo cells. (A) qRT-PCR analyses of HCV RNA expression in the FL-Neo cells treated with anti-HCV nanozymes, DNA-NPs, control DNA-NPs, control nanozymes, and NZ-Ls at varying doses: 0.034 nM (red), 0.14 nM (green), and 0.54 nM (blue). Each bar presents the mean and standard deviation derived from three independent experiments; Student’s t test: ns, nonsignificance: P > 0.14, * for P < 0.01, and ** for P = 0.00053. Ctrl, blank control. (B) qRT-PCR analysis of HCV RNA expression in the FL-Neo cells treated with nanozymes or DNA-NPs three times during 7 d at concentration of 0.067 nM (see SI Materials and Methods). ns: P = 0.58, *** for P = 0.00024. (C) Western blot analysis of NS5A expression in the FL-Neo cells from the treatment in B, which was probed with anti-NS5A antibody and anti-β-actin antibody, respectively. The band intensity (NS5A/β-actin) relative to the control was found to be 0.25 ± 0.02 in the cells treated with nanozymes, whereas it was 0.97 ± 0.07 in the cells treated with DNA-NPs. (D) Immunofluorescence analysis of HCV NS5A expression in the individual FL-Neo cells from the treatment in B. The cells were fixed and the HCV NS5A expression level was examined by using fluorescent immunostaining with anti-HCV NS5A antibody and secondary antibody [fluorescein isothiocyanate (FITC)-labeled goat anti-mouse immunoglobulin G antibody]. The nuclei of the cells were stained with DAPI (4′,6-diamidino-2-phenylindole) as an internal reference. Mean and standard deviation were derived from three independent experiments.

