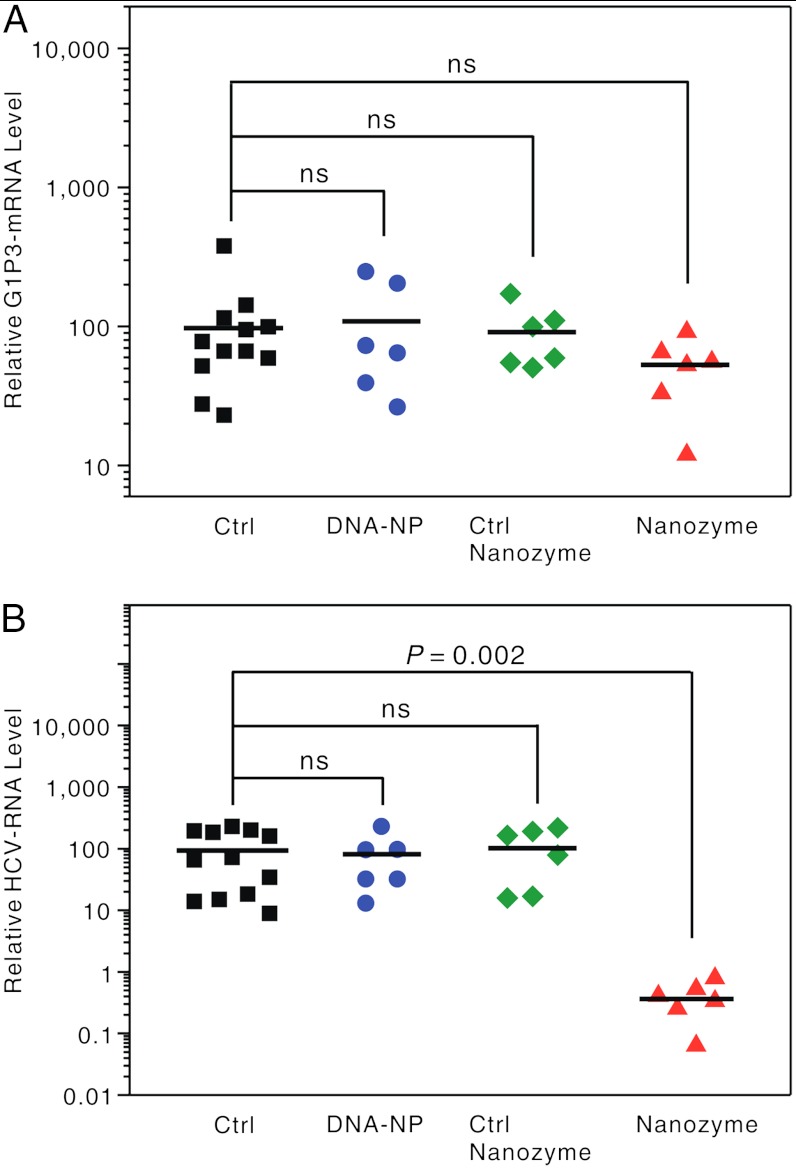
Fig. 4.
In vivo antiviral effect of the nanozyme in xenotransplanted NOD/SCID mice. qRT-PCR analysis of (A) G1P3 mRNA and (B) HCV RNA expression in the xenograft tumors of the mice without treatment (Ctrl) shown as black squares, those treated with DNA-NPs shown as blue dots, control nanozyme shown as green diamonds, anti-HCV nanozyme shown as red triangles (the HCV RNA levels were relative to GAPDH). Each data point represents an individual mouse, and P-values were calculated using Student’s t test: ns, nonsignificance: P > 0.24.

